Every five years, the Department of Agriculture takes a census of farms, all two million of them. The most recent census occurred in 2022, and USDA released the data this week.
I wish I could have set aside all my other work responsibilities and spent the week digging into the data. But, alas, students needed to be taught, midterms needed to be given, teaching schedules needed to be made, papers needed to be reviewed, research projects needed progression, emails needed responses, .......
That said, I did make some time to look at what the census tells us about California dairy farms.
Large dairy farms handle manure by flushing it into lagoons where microbes break it down and, in the process, emit methane, a potent greenhouse gas. Spurred by California's low carbon fuel standard (LCFS) policy, numerous dairy farms have installed large covers known as anaerobic digesters over the lagoons to capture this methane so it can be used to generate energy. This policy and its effect on dairy farming are controversial.
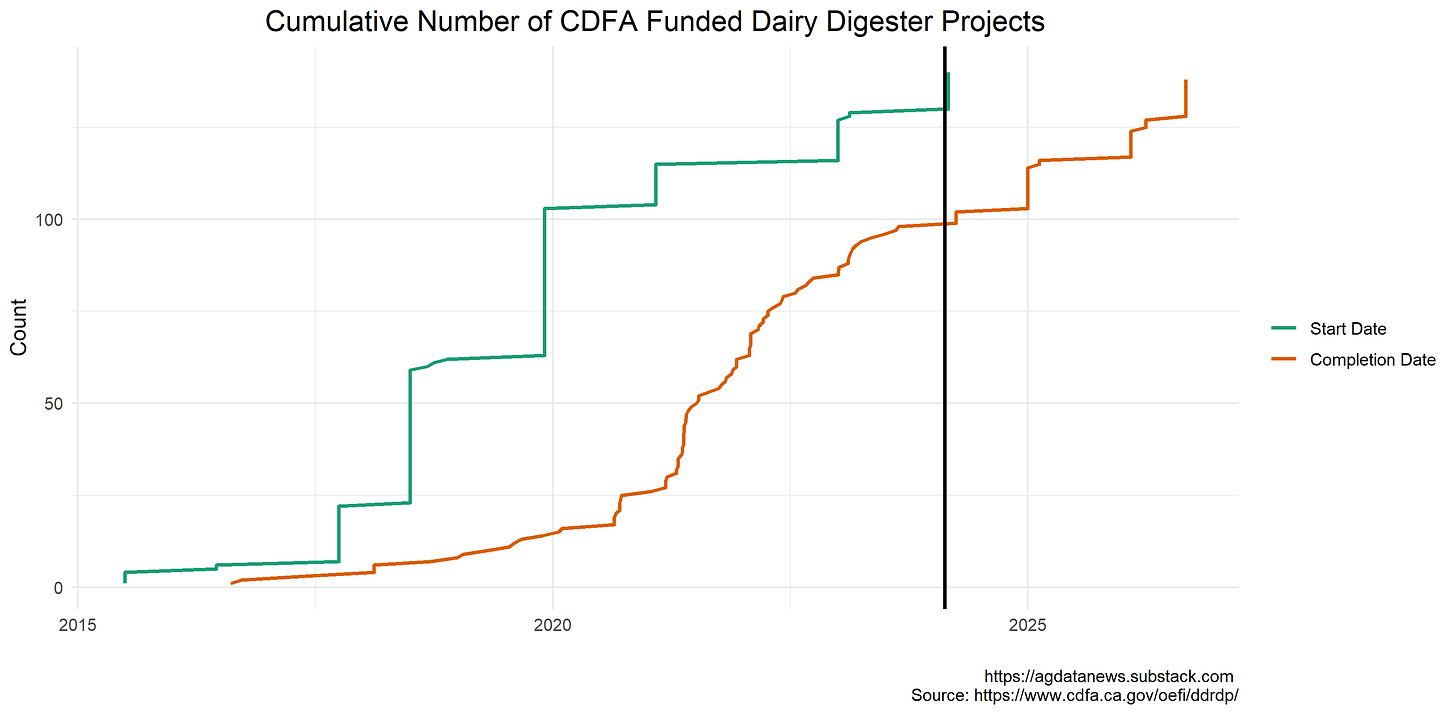
The California Department of Food and Agriculture has funded 140 anaerobic digester projects on dairy farms in the state, 98 of which have been completed. Most projects were completed between August 2020 and March 2023. Digesters are expensive, so it is likely that all recent digesters got CDFA funding and therefore that CDFA data include the vast majority of operating digesters in the state.
I have written at length about this policy and have raised the concern that paying farmers to process manure could cause them to add cows for the purpose of generating more manure.
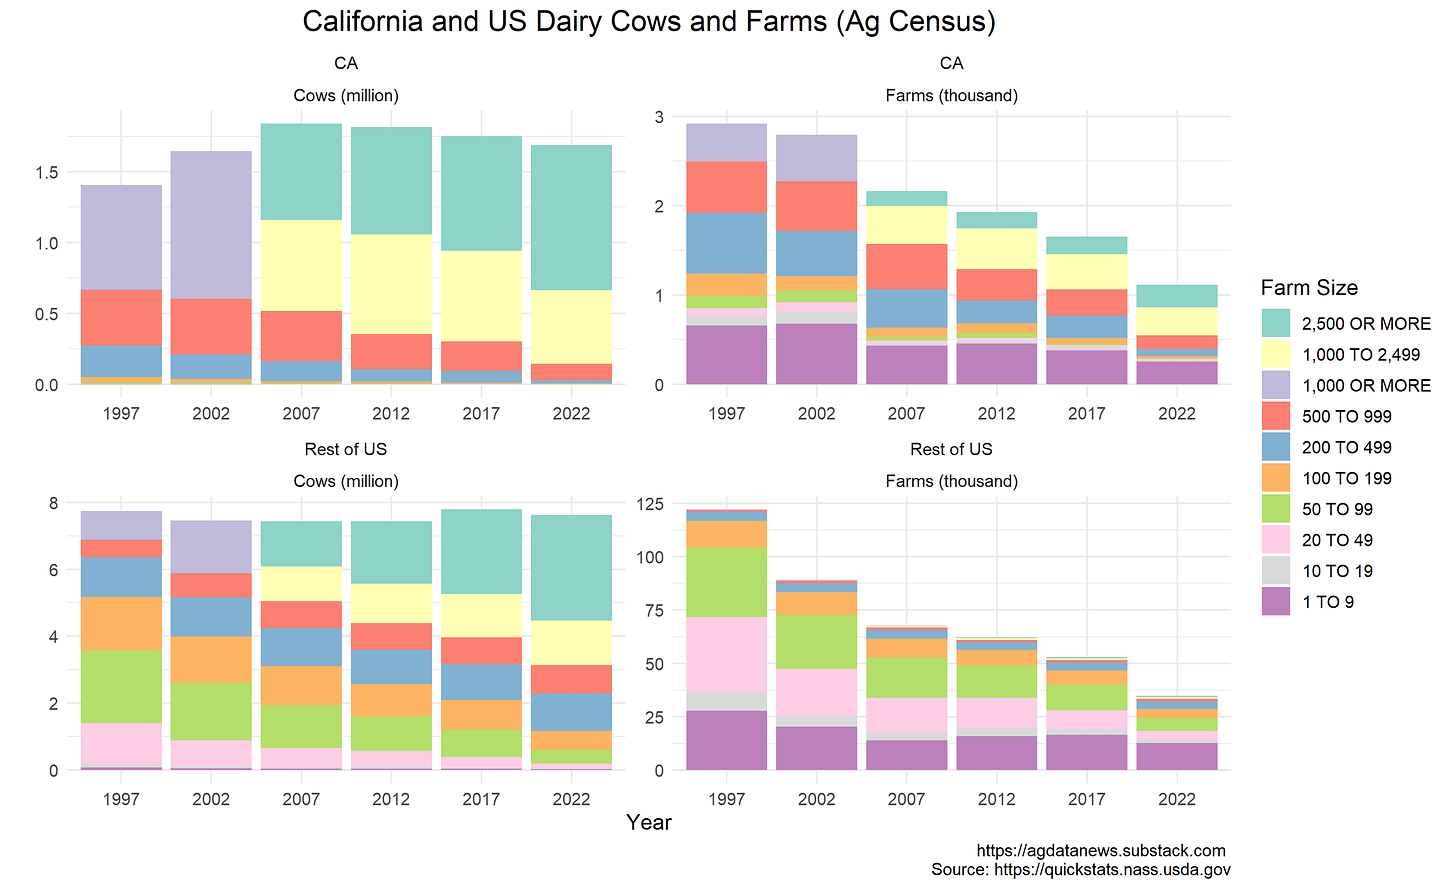
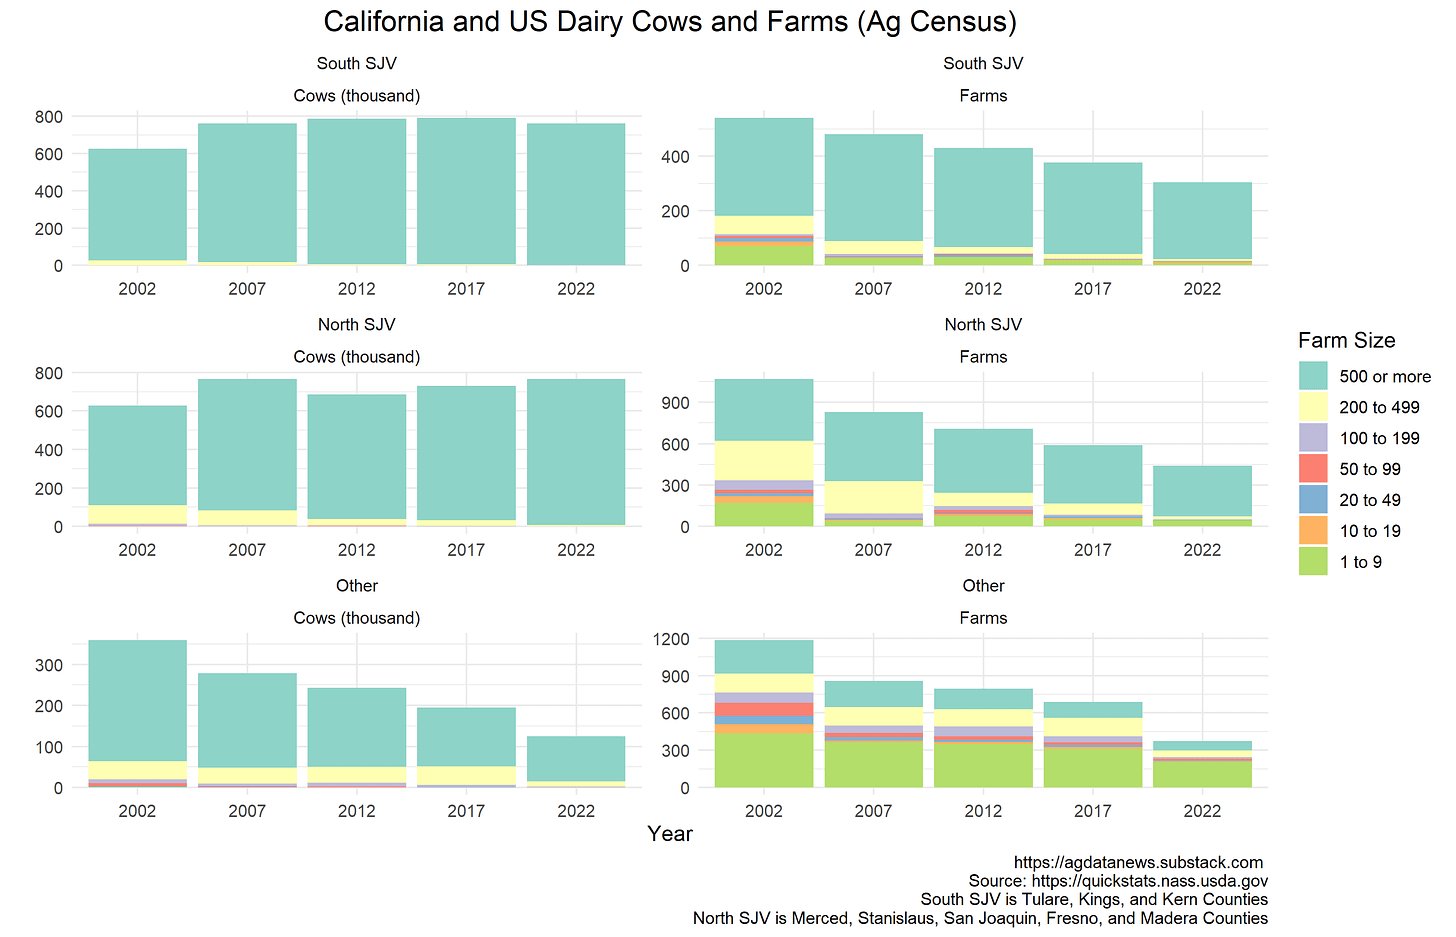
The 2022 census counted 1.69m milking cows in California in 2022, down from 1.75m in 2017. However, the number of cows on farms with 500 or more head stayed constant at 1.66m, which indicates that the decline came from small farms. The number of dairy farms with fewer than 500 cows declined by 50% from 769 to 394.
Outside California, the changes were similar, with dairy cow numbers dropping from 7.79m to 7.62m and thousands of small dairy farms disappearing. The increases in farm size though out the country are a continuation of decades-long trends. (Throughout this article, when I refer to cows, I am referring to inventory of milk cows.)
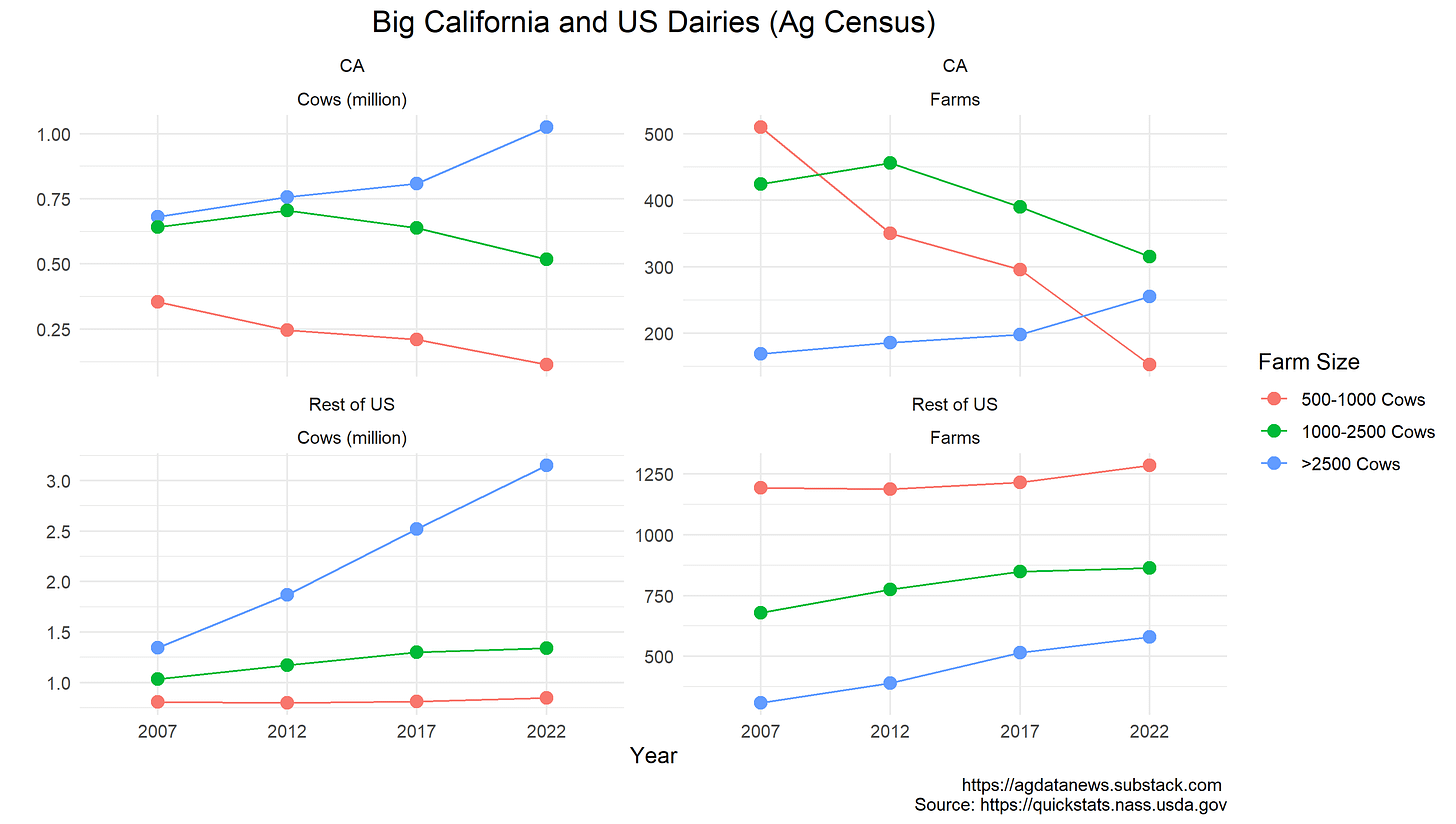
There was a shift in composition within the three largest farm size categories reported in the census. Compared to 2017, there are now 57 more CA dairies with more than 2500 head, and there are 217,000 more cows in dairies with more than 2500 head. Correspondingly, there are 216,000 fewer cows on dairies with between 500 and 2500 head.
In 2022, there were 255 dairy farms with more than 2500 cows. Given that CDFA has funded only 140 digester projects, there appears to be scope for at least 100 more digesters on large dairy farms. The hundreds of dairy farms with fewer than 2500 cows will also need to reduce their methane emissions for compliance with SB 1383, but many of them do not flush manure into lagoons and so may explore alternative manure management practices.
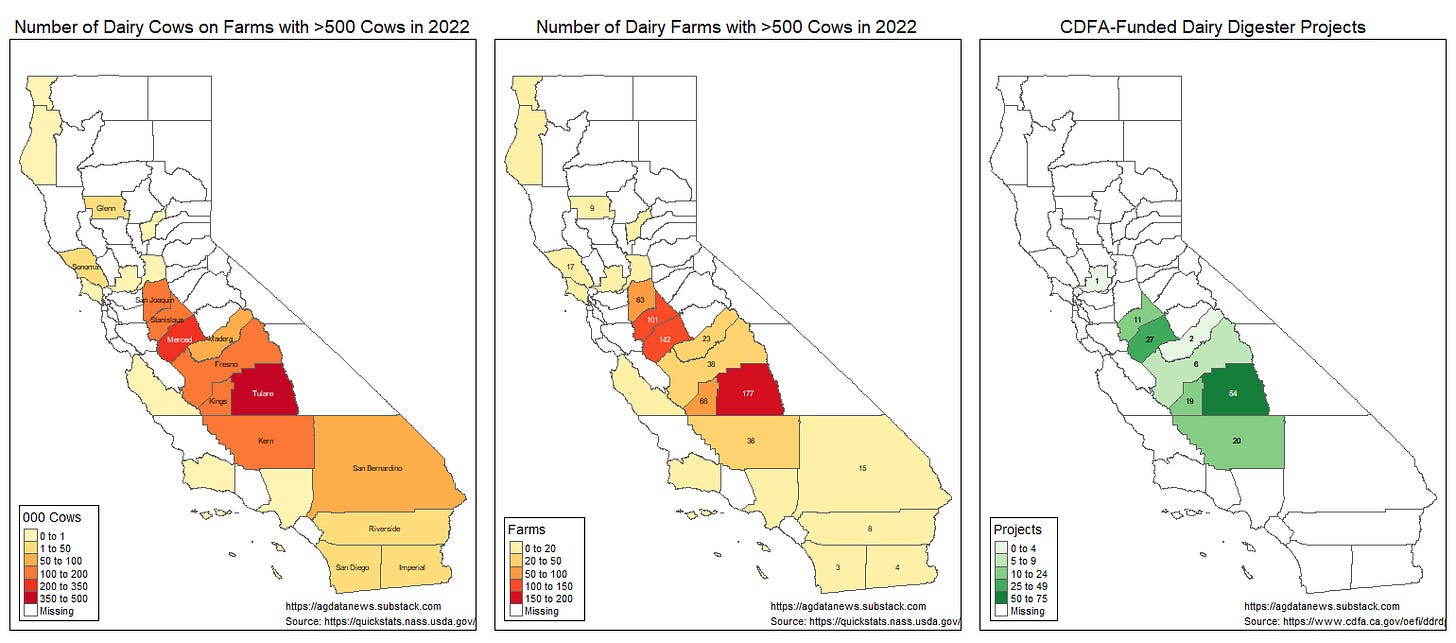
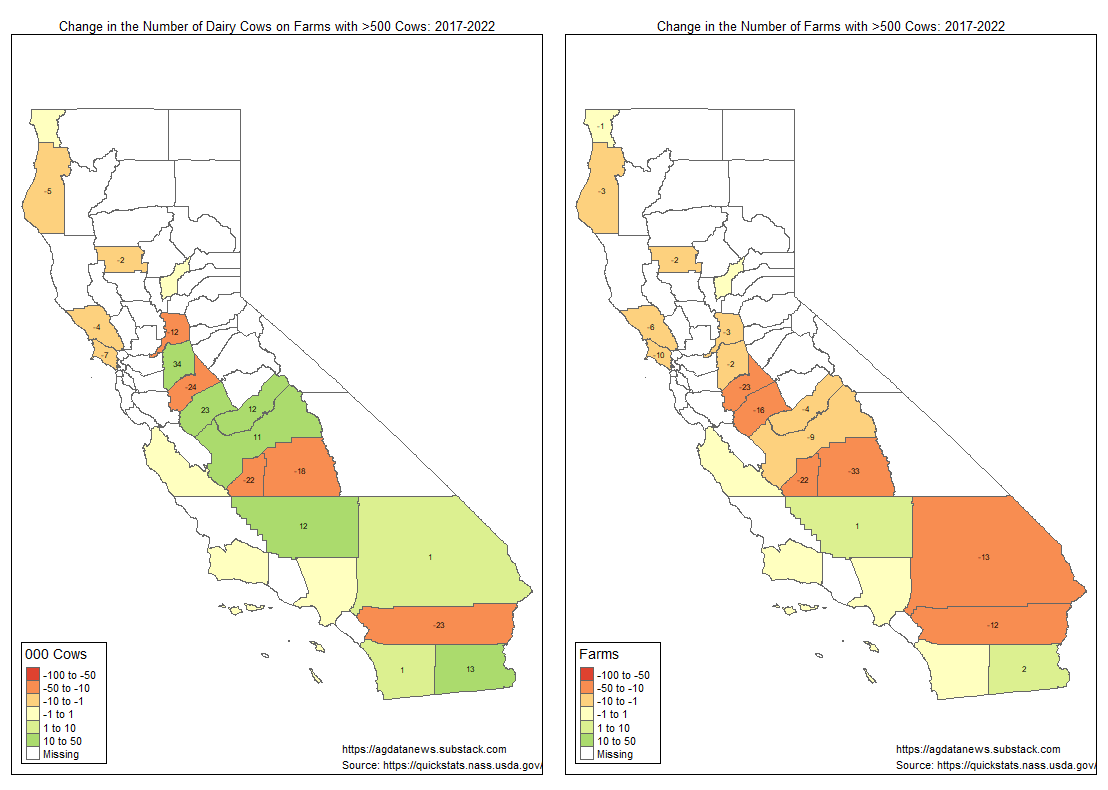
The census reports data by county, although it aggregates all farms with more than 500 head into one category. More than 90% of California dairy cows are now in the San Joaquin Valley on farms with more than 500 head. They are evenly split between the three southern-most counties (Tulare, Kings and Kern) and those further north. Most of the decline in dairy cow numbers from 2017-2022 occurred outside the San Joaquin Valley.
Tulare County contains about 30% of the state's dairy cows. According to the census, it has 177 dairies with more than 500 cows, 54 of which have digesters either operating or under construction. (Tulare County Resource Management Agency claims 297 permitted dairies in 2020 and 292 in 2021, which is a lot more than the census and is something I need to understand.)
Kern County has digesters on 20 of its 36 dairy farms with more than 500 cows. Other counties have a smaller percentage of dairies with digesters, likely because dairy farms in those counties are either smaller or further apart from each other. Digester projects are more cost effective when they can be clustered across multiple close dairies.
Essentially all counties saw a decline in the number of dairy farms with more than 500 cows. Changes in the number of cows vary across counties, with two of the three biggest dairy counties (Tulare and Stanislaus) both losing cattle and other nearby counties gaining.
From the last agricultural census in 2017 to the most recent one in 2022, dairy cow numbers in California declined by a few percent, mostly from small dairies outside the San Joaquin Valley. Perhaps the decline would have been faster without the digester programs, but this is difficult to determine from census data. There was an increase in the number of cows on large farms (>2500 cows) and a corresponding decrease in midsize farms (500-2500 cows), but changes in large and midsize farms vary significantly by county. Perhaps the digester programs accelerated consolidation or inspired some farmers to add cows, but it is difficult to make definitive conclusions from these data.
I made the graphs using this R code.


