

Discover more from Ag Data News
Methane is the second-most emitted greenhouse gas behind carbon dioxide (CO2). Cattle burps and manure are a major source of methane emissions; natural gas leaks and landfills are other prominent sources. Most carbon dioxide emissions are produced by burning fossil fuels.
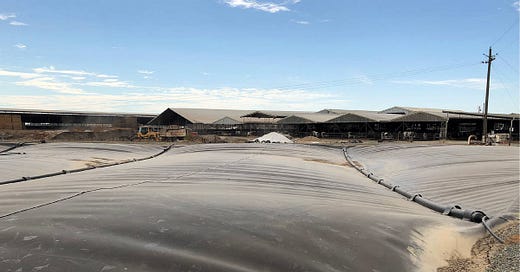
California is targeting a reduction in statewide methane emissions of 40% below 2013 levels by 2030. It is very difficult to reduce cattle burps, so the state has focused on manure emissions, mostly by subsidizing the installation and operation of anaerobic digesters. Dairy farmers wash manure into lagoons, where microbes fed on the contents and emit methane. Anaerobic digesters capture the methane, preventing it from escaping into the atmosphere where it would contribute to global warming. As a bonus, the captured gas can be used in place of natural gas for transportation or electricity generation.
Are these subsidies set at the right value? In this article, I answer that question and update my analysis from 2021 and 2022 on the value of dairy cow manure. In the process, I make three points.
The cost of an anaerobic digester is 10 times the market value of the gas it produces
Anaerobic digesters are valuable because they prevent methane emissions, but they are expensive
Profit from digesters changes dramatically over time due to fluctuations in the value of credits in California's low carbon fuel standard
I present these points and the associated charts first. To see details on how I calculated each number, jump to the end of the article.
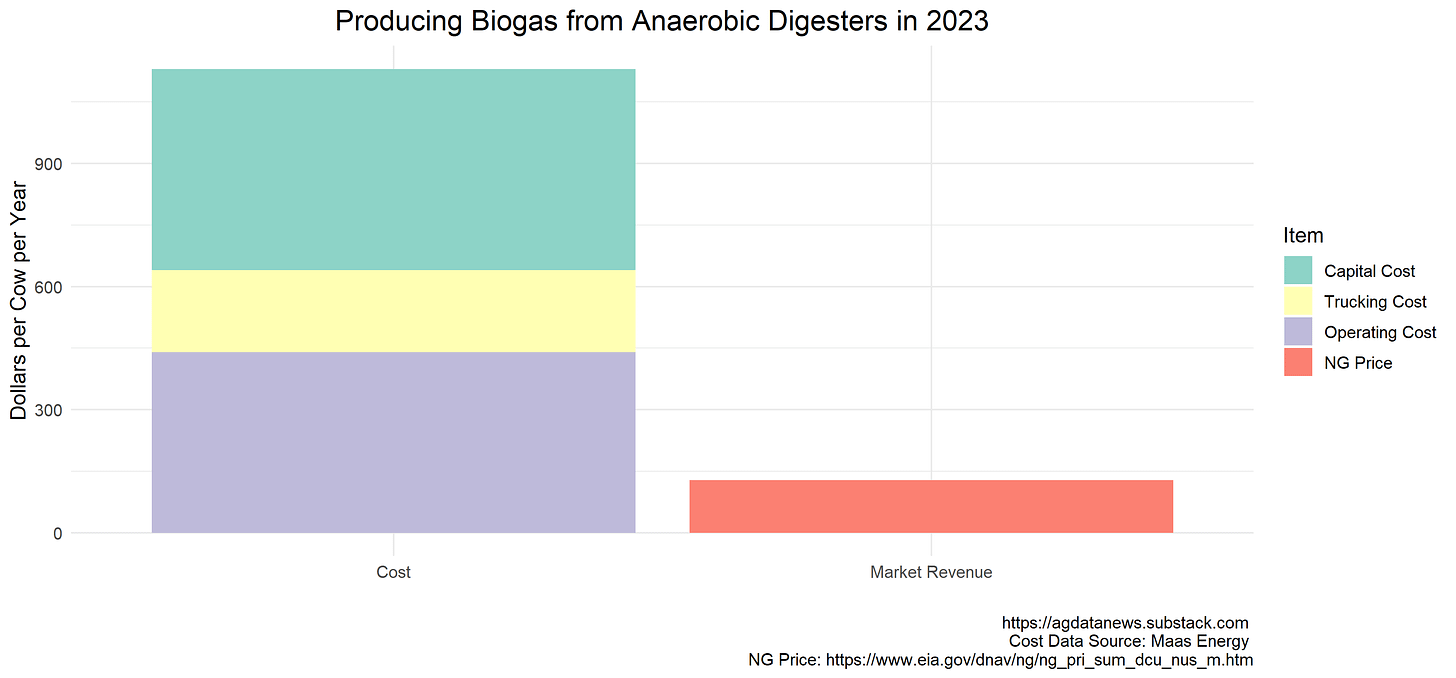
1. The cost of an anaerobic digester is 10 times the market value of the gas it produces
The market value of the gas produced by an anaerobic digester is about $128 per milking cow per year. The digester costs about $1130, comprised of $490 in capital costs, $440 in operating costs, and $200 in trucking costs if unable to connect directly to a gas pipeline.
If they’re such a money loser, why are people spending millions of dollars installing anaerobic digesters on dairy farms?
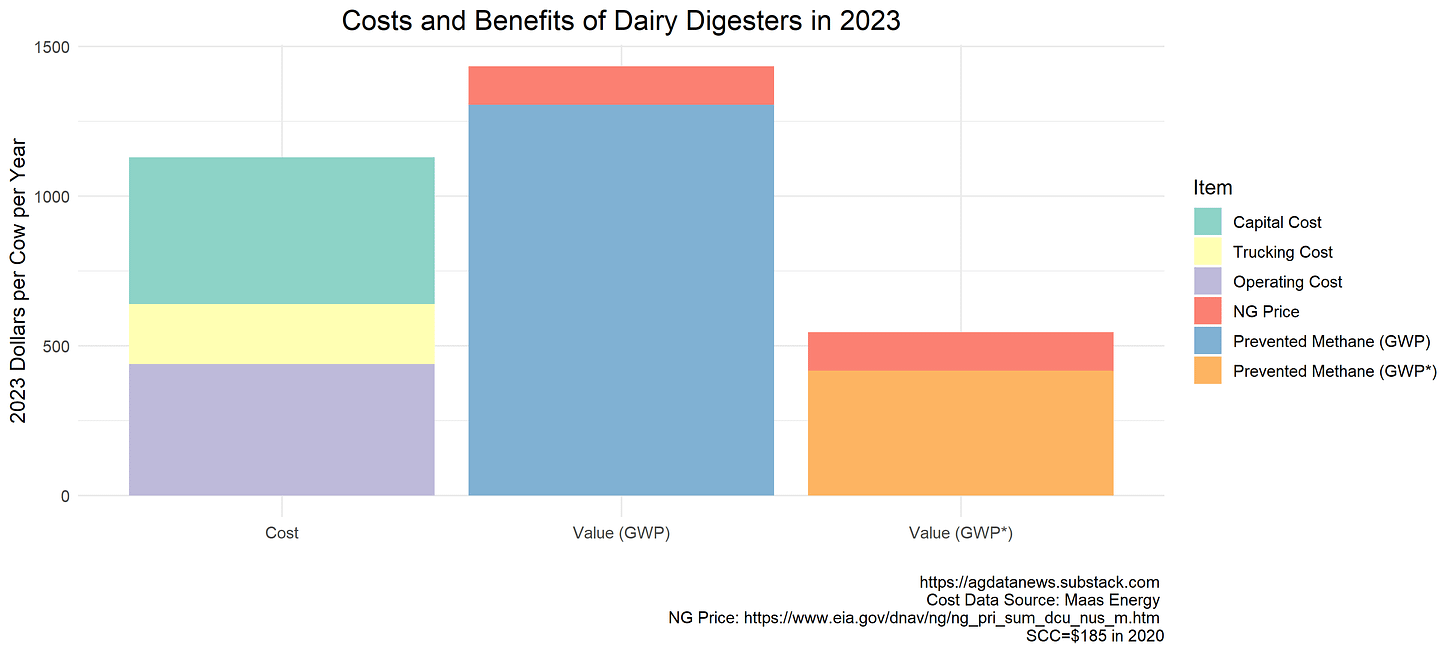
2. Anaerobic digesters are valuable because they prevent methane emissions, but they are expensive
Using the standard method that CARB uses to value methane emissions reductions, known as GWP100, preventing manure methane from escaping into the atmosphere is worth $1300 per milking cow per year. Add revenue from selling the gas, and the benefits of anaerobic digesters exceed their costs by about $300.
Using an alternative method to account for the short-lived lifespan of methane in the atmosphere, known as GWP*, the value of preventing methane emissions is about $420 per milking cow per year and the benefits of anaerobic digesters are much lower than their costs. I prefer GWP*, but there is a vigorous scientific debate on this topic.
GWP* implies that digesters are too expensive relative to their benefits. It is therefore important to find ways to lower the cost of methane emissions mitigation.
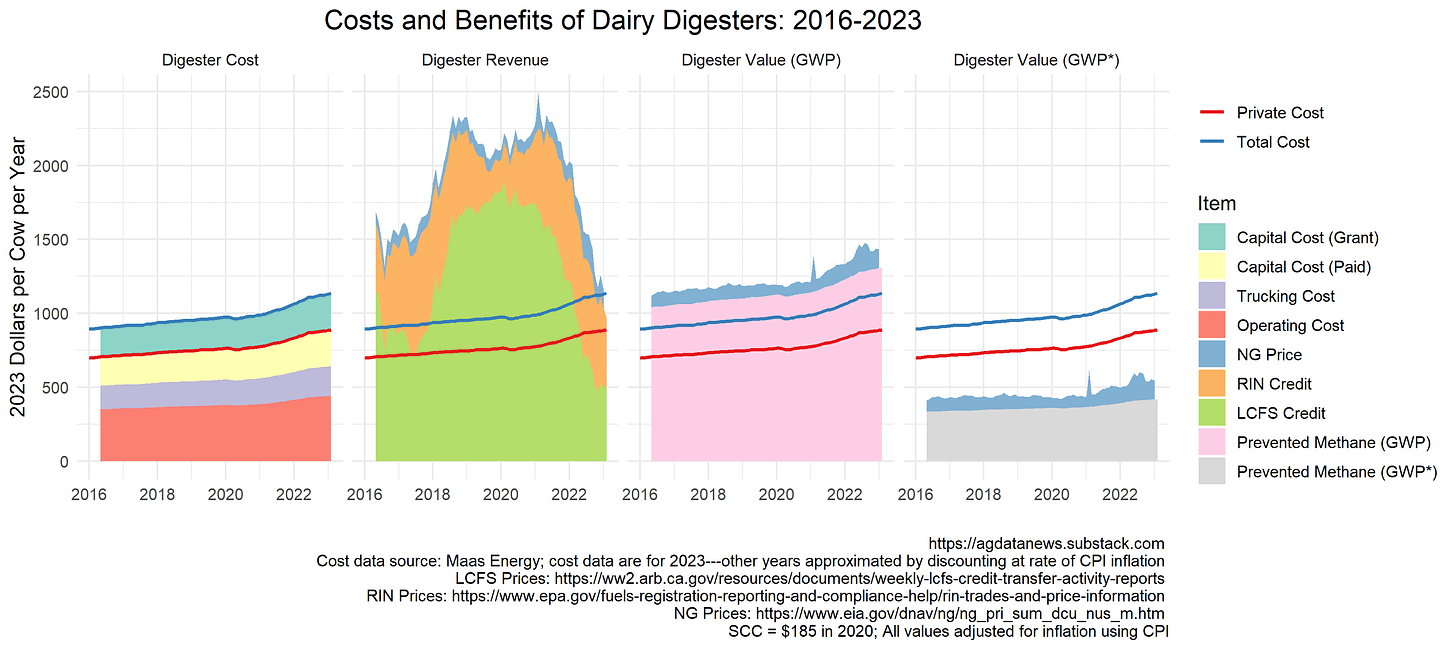
3. Profit from digesters changes dramatically over time due to fluctuations in the LCFS credit market
Three government programs incentivize construction and operation of anaerobic digesters. These programs essentially offer subsidies to compensate producers for the value of prevented methane.
First, using proceeds from the state's cap and trade program, the California Department of Food and Agriculture offers grants to cover capital costs of building digesters. These grants can cover up to half the cost. CDFA has issued $218m in grants to 134 projects since 2015 (data here).
Second, through the state's low carbon fuel standard (LCFS), digester operators can earn credits by selling their gas for use in transportation fuel. The LCFS requires carbon emissions per unit of energy to decline over time. It achieves this by requiring producers of dirty fuels such as gasoline and diesel to purchase credits from producers of clean fuels such as dairy biogas, renewable diesel, ethanol, and electricity. (For more LCFS background see this Ag Data News article. Or this one. To see all the data on the LCFS, check out our LCFS data app.) The price of LCFS credits fluctuates over time depending on supply and demand.
Finally, sellers of dairy biogas generate credits in the federal renewable fuel standard (RFS), which they can sell to oil refineries who need them for compliance in that program.
From mid 2018 through 2021, revenue from digesters was approximately twice as large as costs, mostly due to the LCFS. Those were good times to be in that business. The price of LCFS credits has declined as the market has become awash with renewable diesel, so new digester projects are currently much closer to the break even point. In early 2023, digester revenue was an estimated $1164 per milking cow per year, compared to costs of $885, not including the CDFA grant.
Digester revenue has been substantially higher than the value to society of prevented methane emissions, especially if we measure value using GWP*. This means that society is overpaying for these methane reductions. The cost is paid by producers of gasoline and diesel, who buy LCFS credits and pass the cost along to consumers in the form of higher fuel prices.
Anaerobic digesters have become much less profitable in the last year, but that will change if LCFS credit prices go back up. Based on my preferred way to quantify methane emissions (GWP*), the value of fuel program credits remains higher than the estimated damage that would have been done by the prevented methane emissions. It would be more cost effective if the value of program credits were to match the value of prevented methane.
Even better would be if the cost of methane emissions mitigation were assessed on farmers like New Zealand is trying to do. The cost would be passed along to consumers in the form of higher milk and dairy product prices instead of being borne by consumers of gasoline and diesel. The challenge with this "ideal" policy is it may prompt dairy farmers to move to another state where their emissions would be unregulated, which would defeat the purpose of the policy.
I generated the figures using this R code.
Calculation Details
Cost. According to data provided by Maas Energy in a letter to the California Air Resources Board, it would cost $8.6m to construct a covered lagoon digester in 2023 on a dairy with 2,500 milking cows plus support stock. This is significantly larger than the $4.6m estimate I used in my previous articles. The higher capital costs stem in part from the passage of time (the previous estimates are almost a decade old), more cows (2500 vs 2000), and the fact that newer projects tend to be farther from gas pipelines.
Amortized over 10 years at a 7% discount rate, the capital cost equals $490 per milking cow per year (8600000*0.07/(1-1/1.07^10)/2500).
Operating costs are $1.1m per year plus an additional $500,000 if the project cannot connect to a pipeline and needs to truck the gas to an existing utility pipeline tap. So, we have $440 per milking cow year in operating costs plus $200 for trucking if needed. This cost number is higher than the $294 per cow I used in my previous articles.
Revenue. The digester in the Maas Energy letter would produce 45,000 MMBtu of gas per year. The letter assumes that there are 2,500 milking cows on the dairy and 500 others (e.g., replacement stock). Thus, the digester generates 15 MMBtu per cow in the facility, or 18 MMBtu per milking cow. In my previous articles, I assumed that each cow generated 22.5 MMBtu per year, which was too high because I used a number from a plug flow system rather than a covered lagoon system.
The price of natural gas can fluctuate wildly. I used the US average city gate price because it has better coverage than the CA average city gate price. For the 2023 bar chart, I used $7.11 per thousand cubic feet, which was the US average city gate price in January 2023 and which implies revenue of $128 per milking cow per year. The most recent California city gate price reported by EIA was $7.08 in November last year. Since that time, prices have spiked up and come back down, so the current market value of the gas is likely lower than this.
Social cost of carbon/methane. The latest estimate of the cost to society of emitting a ton of CO2 is $185. This number is in 2020 dollars. Accounting for inflation pushes it up to $215 in 2023.
Methane affects the climate differently than the carbon dioxide (CO2) that is emitted by burning fossil fuels. It is more potent initially, but most of its effect is gone after 20 years. As I explained here (and also here), emitting one pound of methane warms the climate similarly to 128lb of CO2 emitted today and 120lb of CO2 removed from the atmosphere 20 years from today. We need to convert these two numbers (128 and -120) into an equivalent amount of CO2 emitted today.
The standard method is to average the warming potential of the gas over 100 years, which implies that a pound of methane emitted today is equivalent to 25 pounds of carbon emitted today. This is what CARB does. Using CARB's formulas, the digester in the Maas Energy letter has a carbon intensity of -355 grams of CO2 equivalent per megajoule of energy, i.e., it prevents 355 gCO2e/MJ of emissions.
Using GWP, the value of prevented methane emissions is 215*355*1055*(45000/2500)*0.9*/1000000 = $1306 per milking cow per year. I use the following assumptions:
social cost of CO2 in 2023 = 215 dollars per metric ton
CO2 offset = 355 grams per MJ
energy density of CNG = 1055 MJ per MMBtu
gas captured = 45000/2500 MMBtu per milking cow
energy efficiency ratio = 0.9
grams per metric ton = 1000000
To use GWP*, we also need an estimate of the social value of removing CO2 from the atmosphere 20 years from today, and then we need to discount that value back to the present. I'm going to assume that the social cost of carbon grows at the discount rate, i.e., the present value of the 2043 social cost of carbon equals $215. Thus, 128lb of CO2 emitted today and 120lb of CO2 removed in 2043 has the same value as 8lb emitted today.
So, using GWP* implies a value 8/25 times as large as the value using GWP, and (8/25)*1306 = $418 per milking cow per year.
Credit values. LCFS credits are based on the difference between the carbon intensity standard (89.15 in 2023) and the carbon intensity of the digester (-355 in our example). So, the LCFS credit value is (45000/2500)*(CI+355)*0.9*1055*(inflation adjusted LCFS credit price)/1000000 per milking cow per year.
RIN credits are based on the volume of the fuel rather than its estimated life cycle carbon emissions. Dairy biogas generates 11.727 RINs per MMBtu, so the RIN value is (45000/2500)*11.727*(inflation adjusted RIN credit price) per milking cow per year.
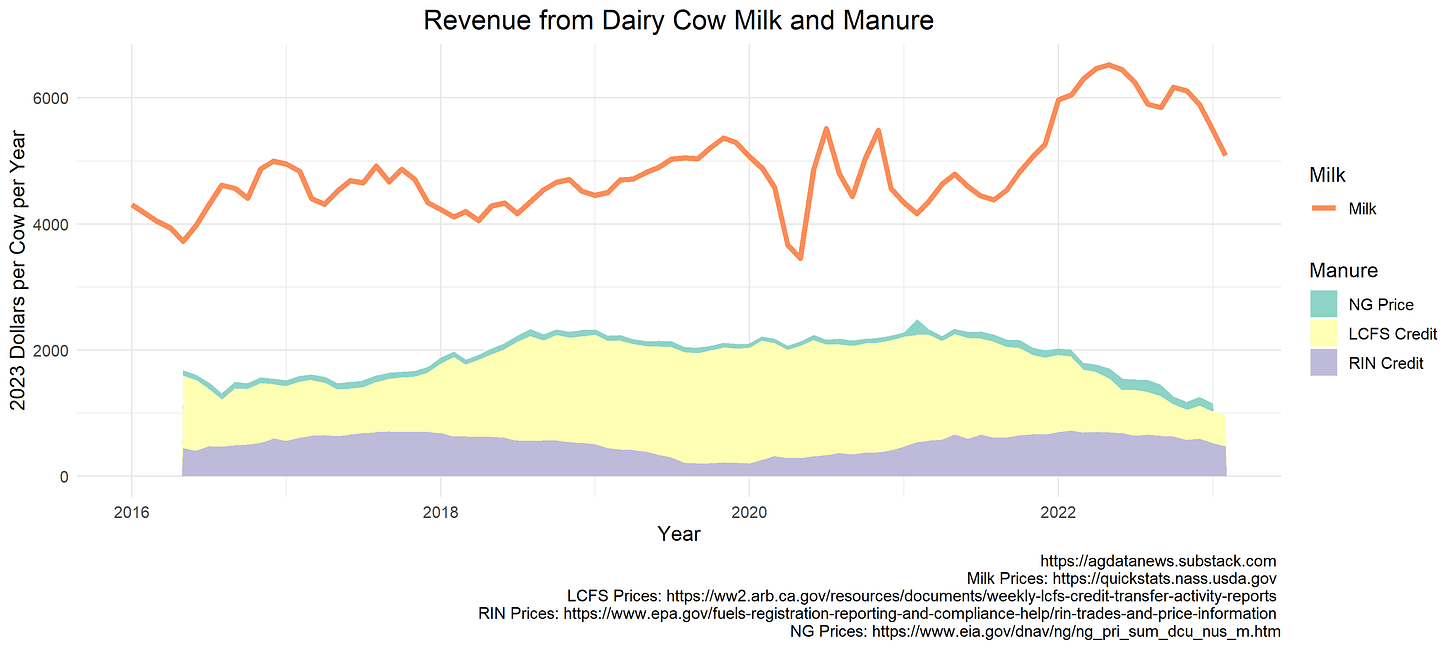
PS: Since my previous articles compared revenue from dairy biogas to revenue from milk, here's a plot of that comparison. I demoted it to the end of this article because I wanted to emphasize revenue and costs equally in the body of the article. The milk price is the average price received by farmers, and I assume each cow produces 230 cwt of milk per year.
Subscribe to Ag Data News
Agriculture, Economics, and Data







Aaron, great article! AD is undoubtedly expensive for the industry to deploy. I can appreciate with your focus on the LCFS, that your analysis up to this point has been focused on methane avoidance and the GHG benefits. However, methane avoidance is not the only environmental value these systems generate. For farmers, digesters are a tool to manage crop residues, stabilize nutrients, and create a more efficient nutrient management systems. This certainty has environmental value in the form of lower infield N20 and CH4 emissions, as well as fewer nitrate leaving through waterways. Is there any interest in attempting to quantify the additional environmental benefits these system provide, outside of just avoiding CH4 from manure?
Thank you and keep up the great work!
Great article and accurate analysis on the cost and GHG policy benefits. Thanks for taking the time to accurately document this important topic.
The benefit side of the analysis is even less due to updated analysis on methane gas. Methane gas is a potent GHG as measured in the laboratory as a single gas. But in the atmosphere methane is a dilute and weak GHG gas due to competition with water vapor and CO2 absorbing most of the long wave infra-red energy.
More up-to-date analysis on GHG gases is finding 89% of global warming due to water vapor, 10% due to CO2, Methane 0.004% and 0.005% due to Nitrogen Dioxide. These NASA satellite-based observations were reported in a recent article The Impact of CO2, H2O and Other “Greenhouse Gases” on Equilibrium Earth Temperatures. The science and math on methane absorption is described in this article; Methane: The Irrelevant Greenhouse Gas – Watts Up With That?