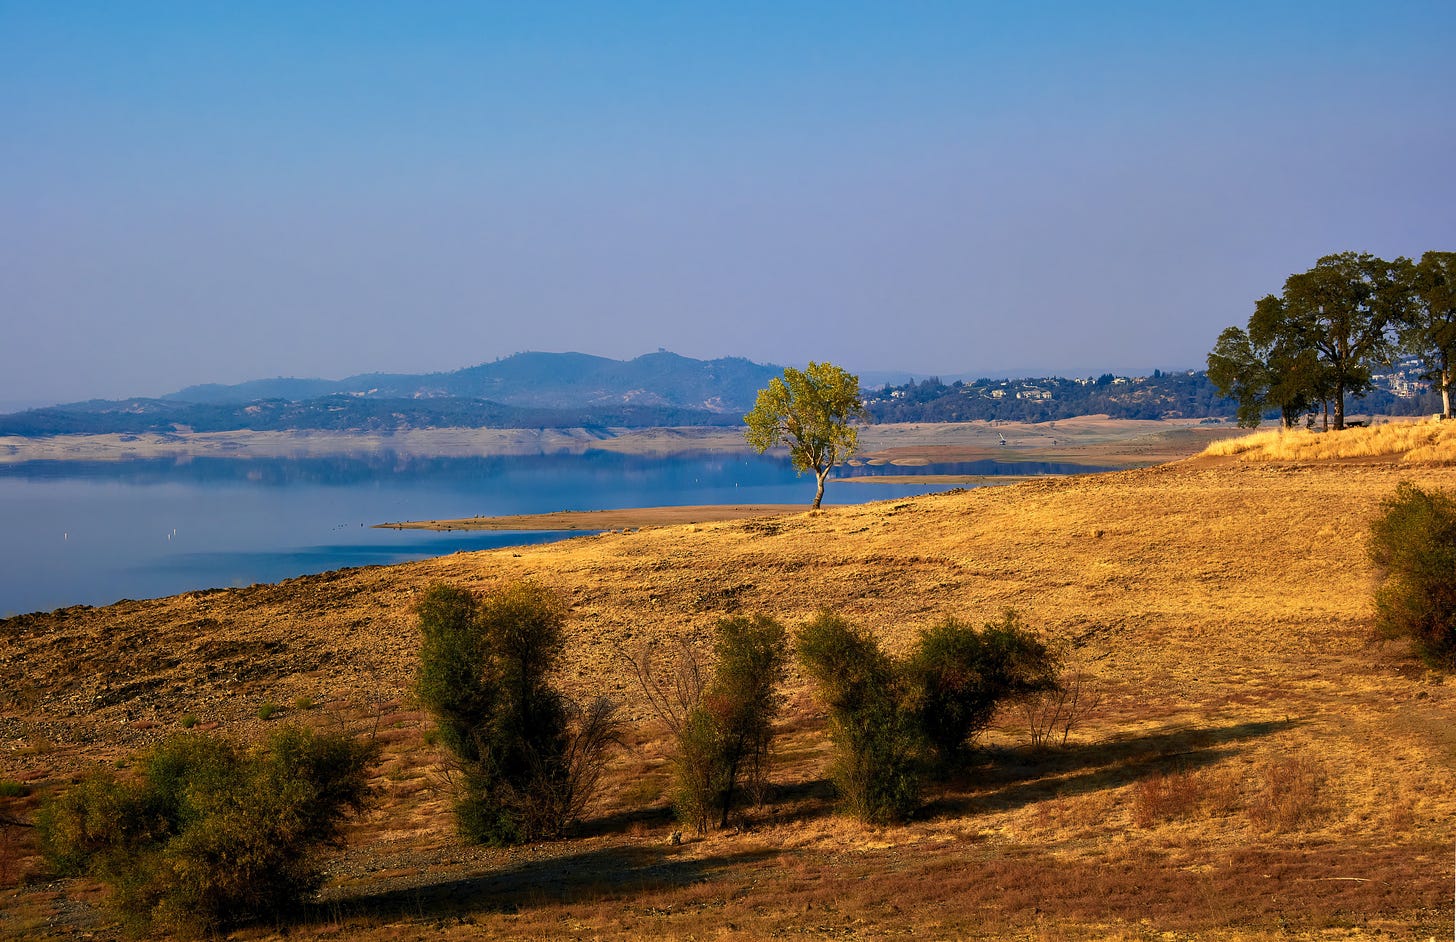
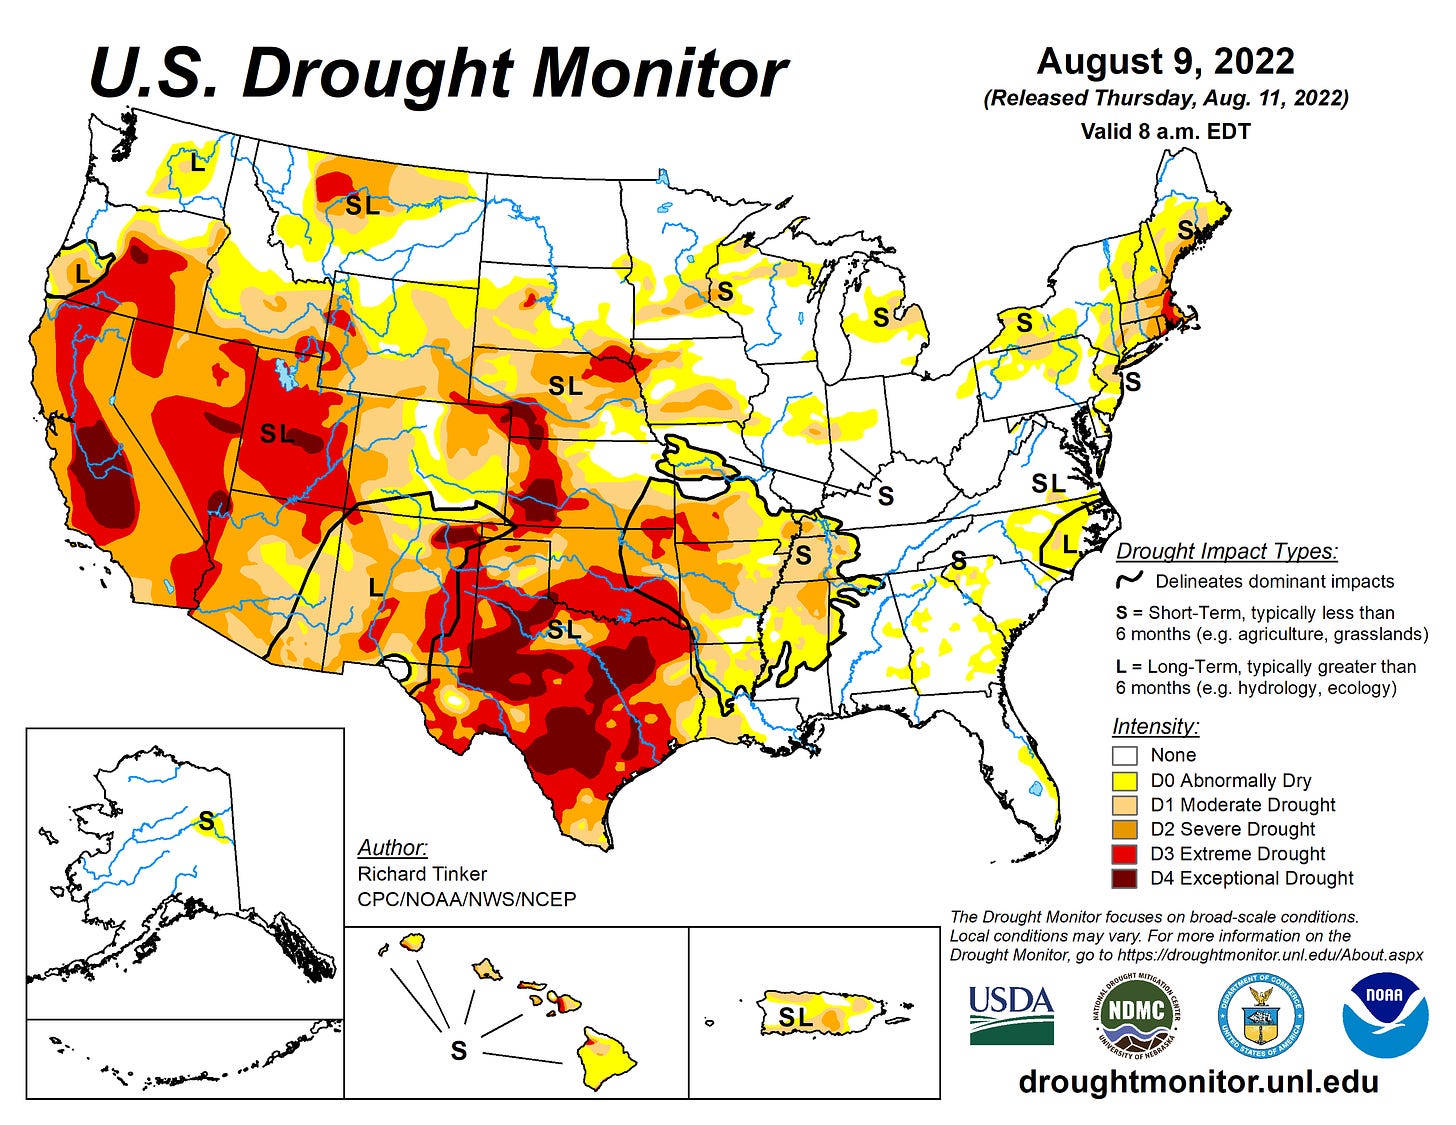
California and much of the west remain in severe drought. This is the second year of the current drought, which started a few short years after the 2014-16 drought. As the climate changes, persistent droughts will be the new normal, creating huge challenges for California agriculture. Meeting these challenges may cause the state to lose 10% of its cropland.
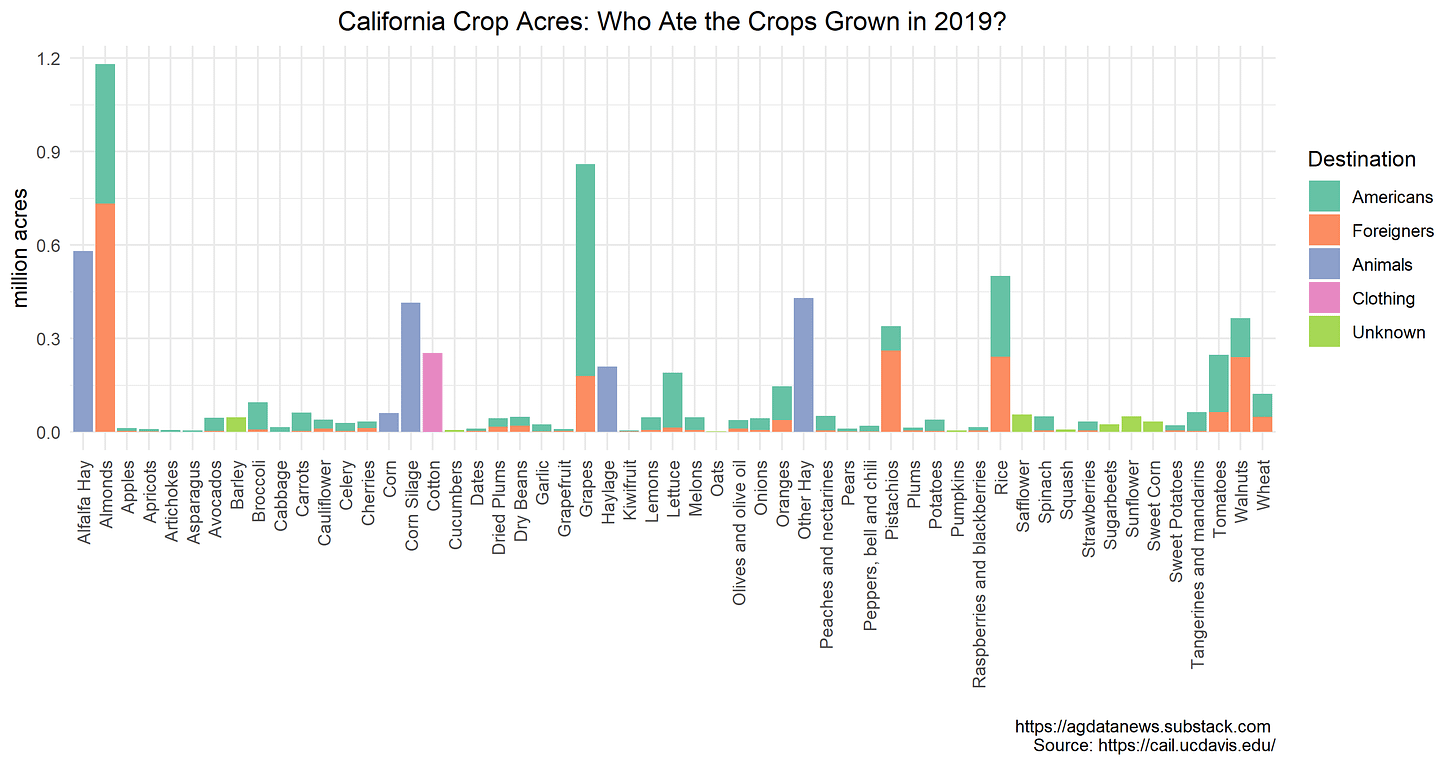
Today, the USDA will release the year's first data on which crops farmers have planted this year, allowing us to assess the drought's effects on crop acres. I'll write about that next week. Today, I look at the crops recently grown in California and where they go after harvest. How much is eaten by Americans, foreigners, and animals?
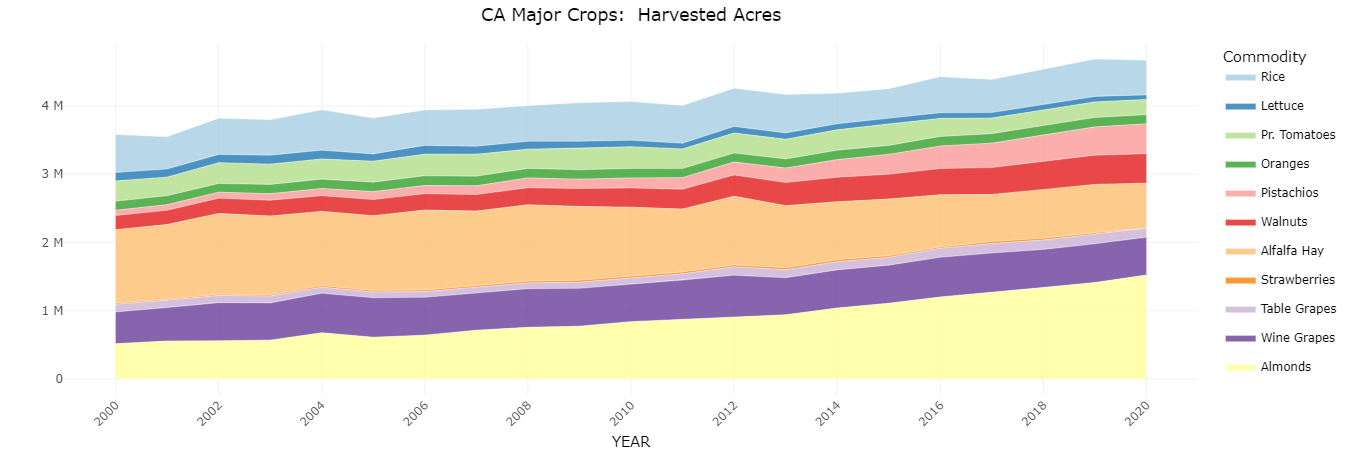
Each year, California farmers plant more than 50 different crops on a total of more than 5 million acres. Unlike most other states, California farmers grow a very diverse range of crops, ranging from almonds to rice to broccoli. The top 10 crops comprise about 75% of acreage, whereas the top 10 crops make up more than 98% of acreage in each of the other top agricultural states.
The main changes in the past 20 years have been increasing almond and pistachio acres and decreasing alfalfa hay. Other annual crops such as cotton and wheat have also declined in acreage.
Where do these crops go after harvest?
The California Agricultural Issues Lab (run by my colleague Dan Sumner) produces data on estimated exports of California agricultural products. This is an easy task for some commodities and hard for others because the available data on exports are measured at the national level. For example, California produces essentially all the almonds in the country, so the odds very high are if you see an almond exported, it was produced in California. In contrast, many states produce alfalfa hay, but there's no tracking of which export shipments come from California or South Dakota or any other state.
To obtain estimated exports for each commodity, "AIC uses a variety of data sources, combining formal operations and informal adjustments depending on the commodity and industry. Industry sources are helpful, either providing explicit export data or guiding us to other sources."
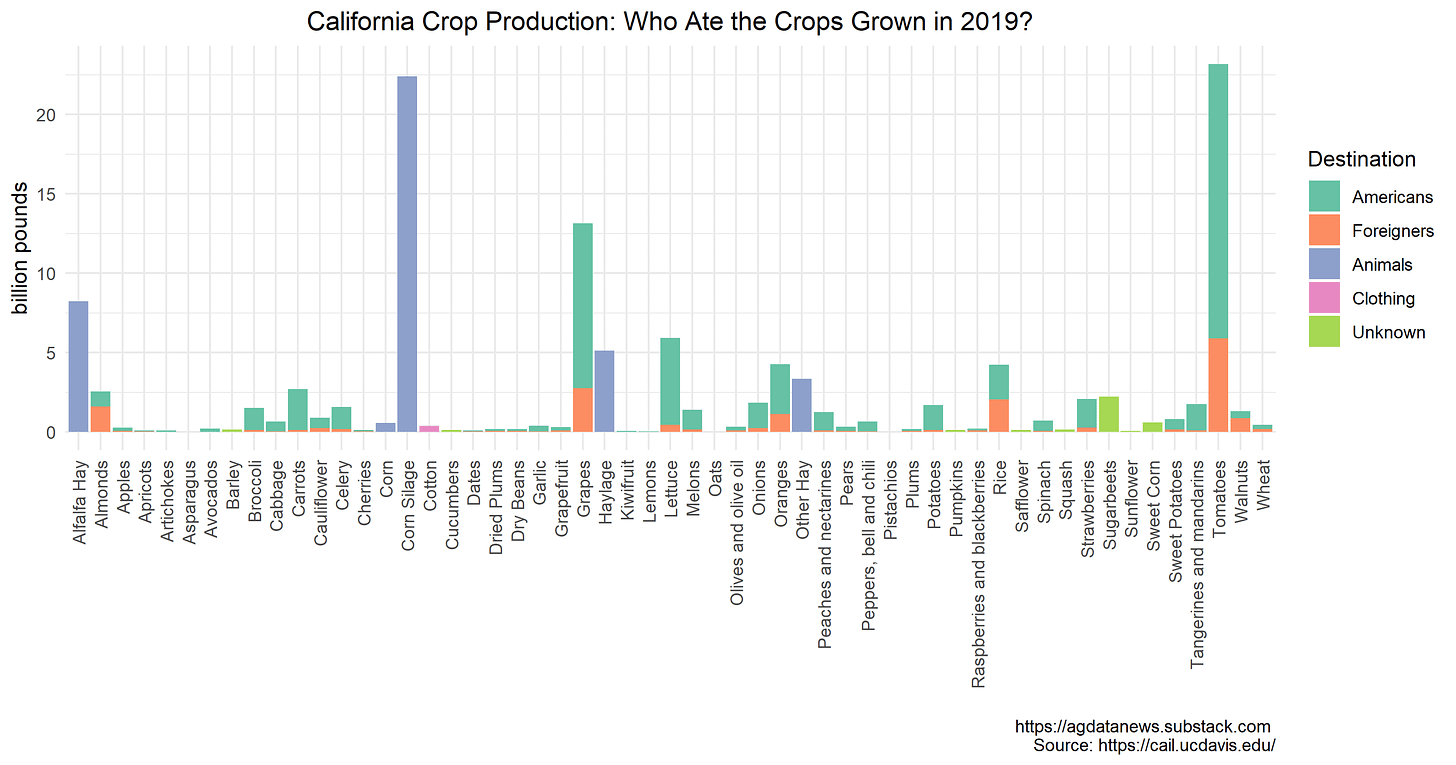
In 2019 (the most recent year available), California both produced and exported more tomatoes by weight than any other crop. Of the 23 billion pounds produced, an estimated 5.9 billion were exported. Now, this statistic is somewhat misleading because the vast majority of these tomatoes are processed into paste, which takes out the water and reduces its volume by a factor of 6, i.e., it is more accurate to say the state exports a billion pounds of tomato paste rather than 5.9 billion pounds of tomatoes. The state also exports billions of pounds of almonds, grapes, and rice.
Other bulky products produced in the state include hay, silage, and lettuce, in large part because we (or the cows) eat the entire plant (roots excepted).
Production per acre varies widely across crops, so the picture looks different if we focus on land use. In 2019, Californian farmers used about 2 million acres to grow food for export, including 730,000 acres of almonds, 260,000 acres of pistachios, and 240,000 acres of walnuts. Grape and rice exports also use substantial acreage. Some of the animal feed was also likely exported.
It is good to export food products. It provides value to the international consumers who eat them and to the California producers who create them.
However, one could look at these data and say: "If we stopped exporting almonds, then we could retire 10% of crop acres without taking almonds away from American consumers." This reaction mirrors a common sentiment whenever food markets are stressed. High food prices often cause exporting countries to restrict exports so as to reduce prices for domestic consumers. Low food prices often cause countries to restrict imports so as increase prices for farmers.
Others may look at hay or cotton and question why we are using precious land to feed animals or to make t-shirts in the face of declining water resources.
Such arguments are value judgments. If you don't value the dairy production that comes from cows fed hay and silage, or the clothing that comes from cotton, or the consumption of foreigners, then those are the first places you recommend cutting back.
In our economic system, we make such value judgments using dollars. It's how farmers compare apples and oranges, or in this case, almonds and cotton. Dollar value explains why almond acreage has expanded and alfalfa hay production has declined, and it will drive the land use changes in response to persistent droughts and climate change.
More in the coming weeks.
I make the bar graphs using this R code.


Curious if you know the percentages of how much alfalfa is exported? I know the US exports a considerable amount of alfalfa to China and Saudi Arabia, for example, but it's hard to find clear figures.