USDA Jolts Corn and Soybean Markets
The markets for America's biggest crops have experienced two large shocks in the past two weeks, both instigated by reports from the USDA.
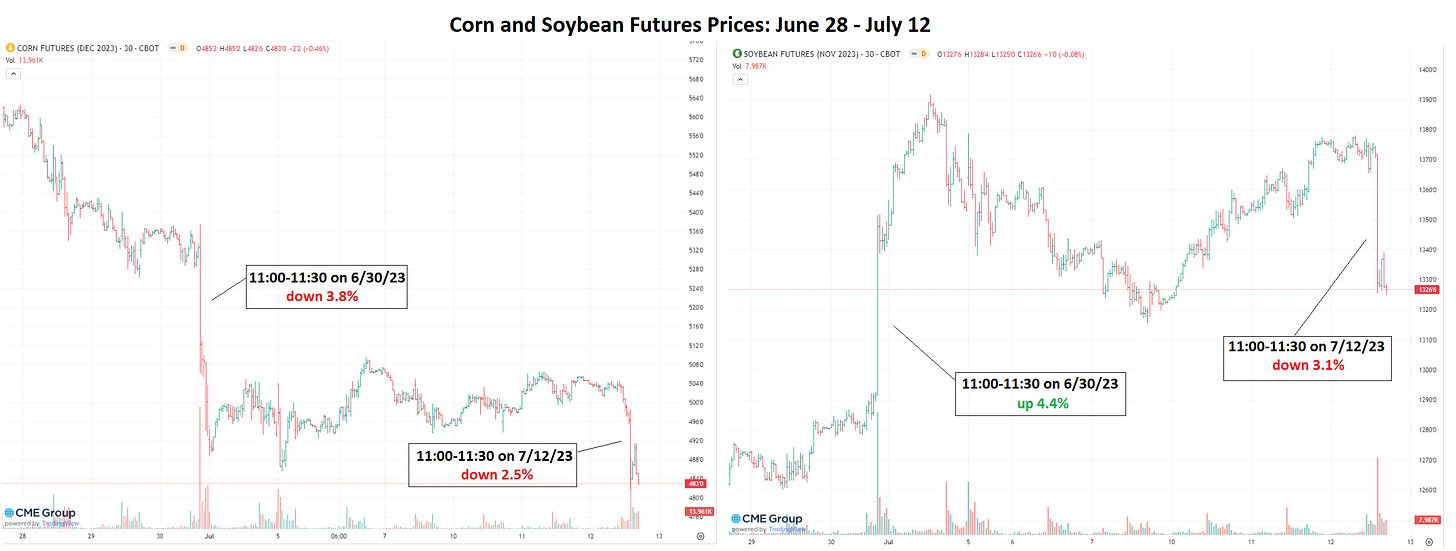
At 11am central time on June 30, corn prices dropped 3.8% and soybean prices jumped 4.4% on news from USDA that farmers had planted more corn and less soybean than expected. At the same time on July 12, corn prices dropped 2.5% and soybean prices dropped 3.1% as USDA yield projections came in higher than expected.
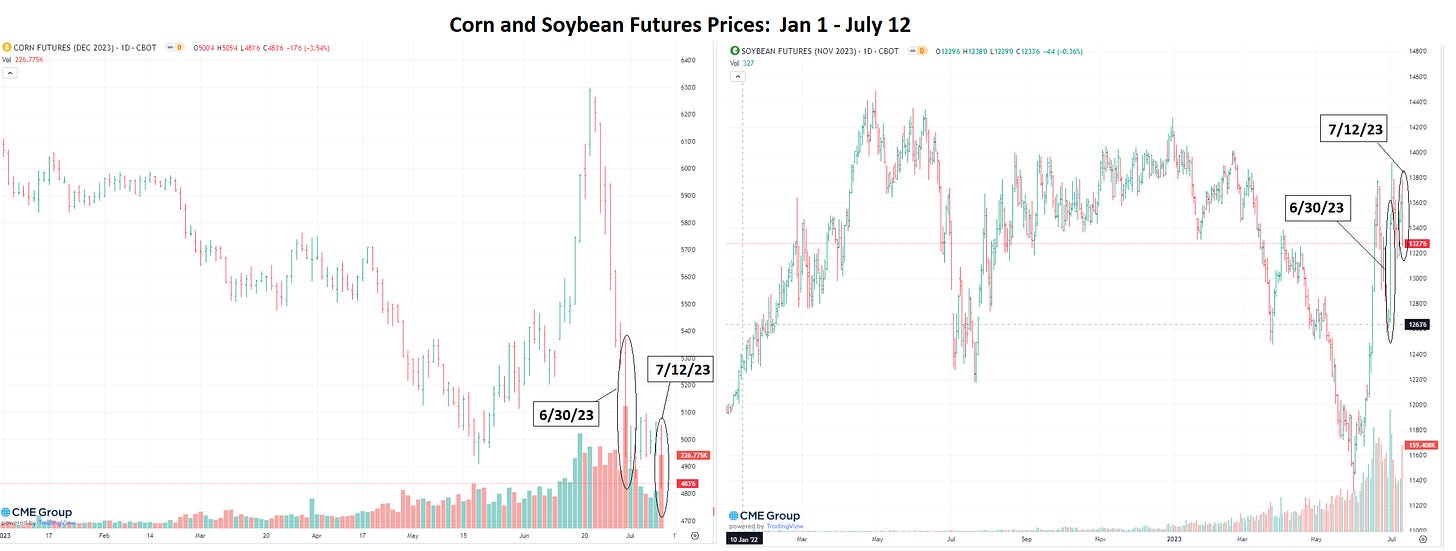
Close watchers of the markets may be surprised that I emphasize these two events. In the last two months, the corn price went from $5 all the way up to $6.30 and back down to $4.80. Soybean prices went from $14 in early March down to $11.50 in June and back up to almost $14.
Why am I focusing on the isolated 20-50c jumps from these two USDA events?
Answer: because we know what caused them.
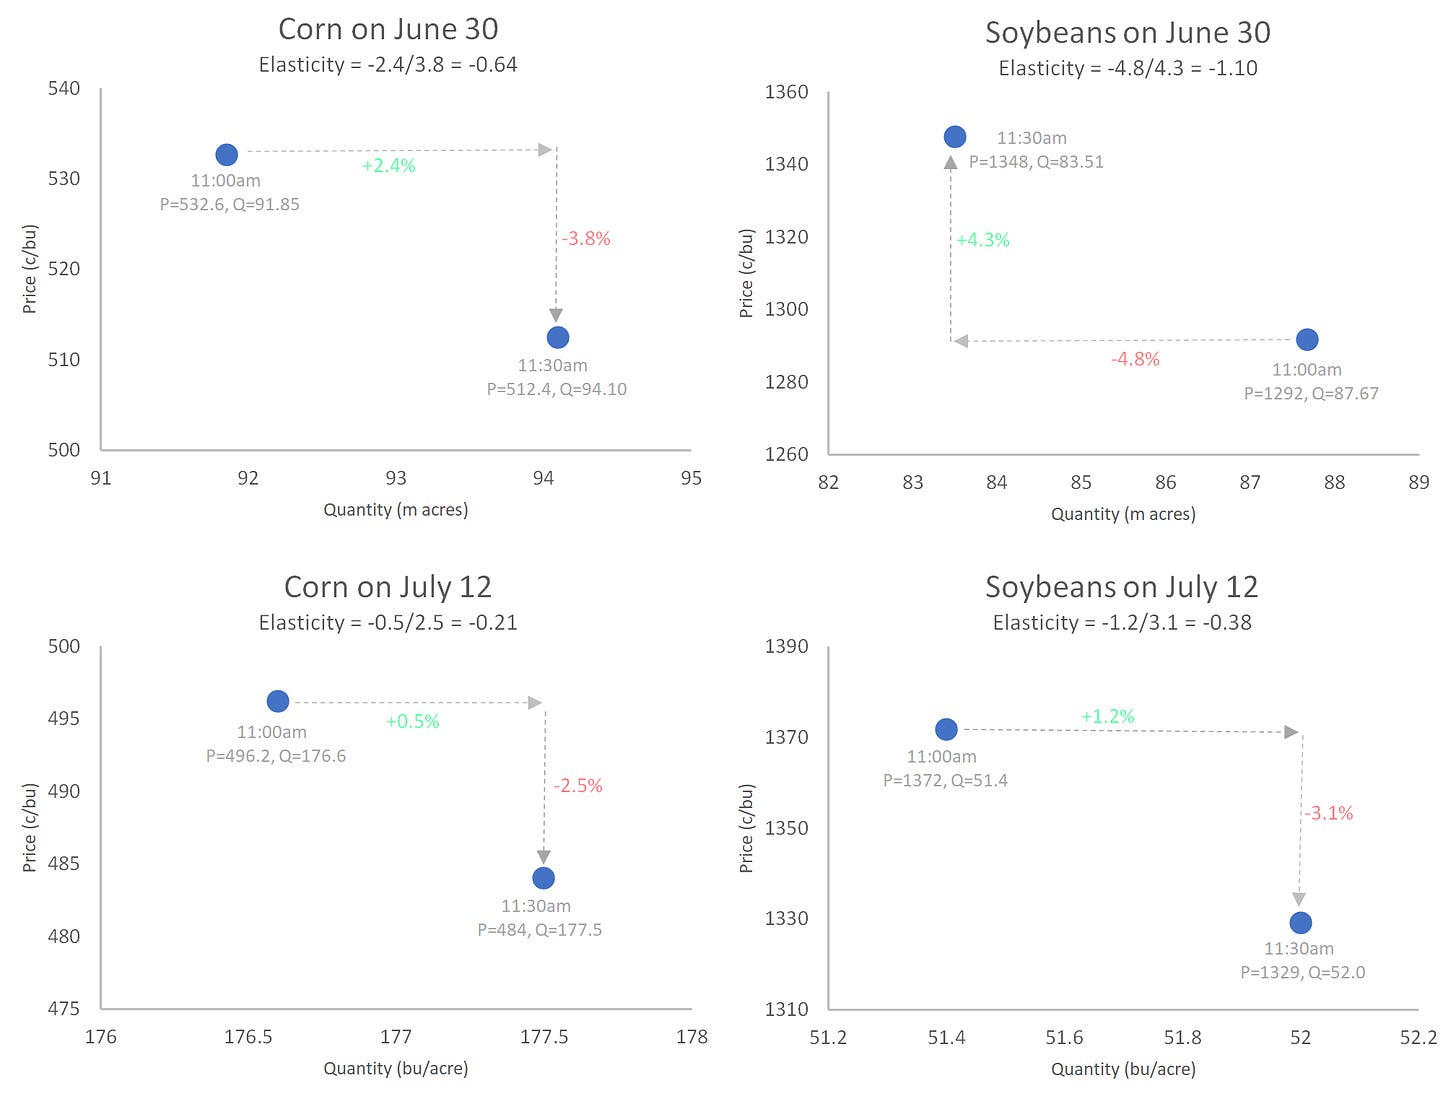
In both events, we learned that the market would get a different amount of the crop than it had been expecting. Before 11am on June 30, traders thought farmers had planted 91.85 million acres of corn. Then the USDA told us the number was 94.10. That's 2.4% more corn than expected. To sell that extra corn, the price needed to drop.
Economists get really excited about events like these because we can use them to estimate key economic parameters. In this case, the price response reveals the elasticity of demand, i.e., how much the price needs to drop to get consumers to buy more product.
Most price changes have multiple potential causes, which means they give murky information about key economic parameters. Did the price increase to convince consumers to use less or to convince producers to supply more, or both? In this case, supply is pre-determined because the crop is in the ground, so we can interpret any price response as coming from the demand side.
The demand elasticity is important to know an many contexts. We needed it to estimate how much grain the world lost when Russia invaded Ukraine or when a windstorm hit Iowa. We needed it to estimate how much extra land was used for corn when the government increased biofuel mandates. Knowing the demand elasticity also tells us the cost of restricting international trade.
The first USDA event gave elasticities about three times larger than the second event. The price response to the first event imply elasticities of -0.64 for corn and -1.10 for soybeans. The second event implies elasticities of -0.21 and -0.38.
So, which ones are right?
An important difference between the events gives us a potential answer. The first event revealed an increase in corn supply and a simultaneous decrease in soybean supply, whereas the second event revealed an increase in both commodities. If buyers are willing to substitute corn for soybean in response to the first event, then prices don't need to change by as much to ration the supply.
Put differently, buyers are more elastic when supply moves in opposite directions because they switch to the more plentiful commodity.
There are at least two types of buyers that would be willing to substitute corn for soybeans. First, storage firms will store more corn and less soybean in response to the first event because they expect farmers to grow relatively less corn and more soybean next year. Second, export buyers will demand less of the relatively scarce American soybean and more of the relatively plentiful American corn, and they would plan to buy more soybean and less corn from Brazil and Argentina, whose farmers will plant more soybean and less corn because the soybean price has gone up and the corn price has gone down. Third, some domestic users may substitute some corn for soybean in animal feed.
Transparent market events are exciting for economists because they enable us to quantify important economic parameters such as the elasticity of demand. Elasticities are higher when the supply of substitutes moves in opposite directions.
PS: For comparison, Mike Adjemian and I estimated in a 2012 paper how much corn and soybean futures prices change when the USDA changes its production estimates. We used data from 1981-2010 and found elasticities of -0.74 for corn and -1 for soybeans. However, the elasticities were smaller when the markets were tight such as when inventories were low or during the ethanol boom. We did not investigate how the elasticities differed depending on whether the corn and soybean production estimates moved in the same or opposite directions, but that is a good topic for someone to investigate.


