
Discover more from Ag Data News
Methane: Put Another Log on the Fire
This week, the United Nations Intergovernmental Panel on Climate Change released a new 3900-page report on the physical science of climate change. It says that humans are causing climate change. Numerous outlets have published summaries and reactions, so I won't focus on that. Instead, I want to highlight a potential change in how methane emissions are quantified, which may have large implications for livestock agriculture.
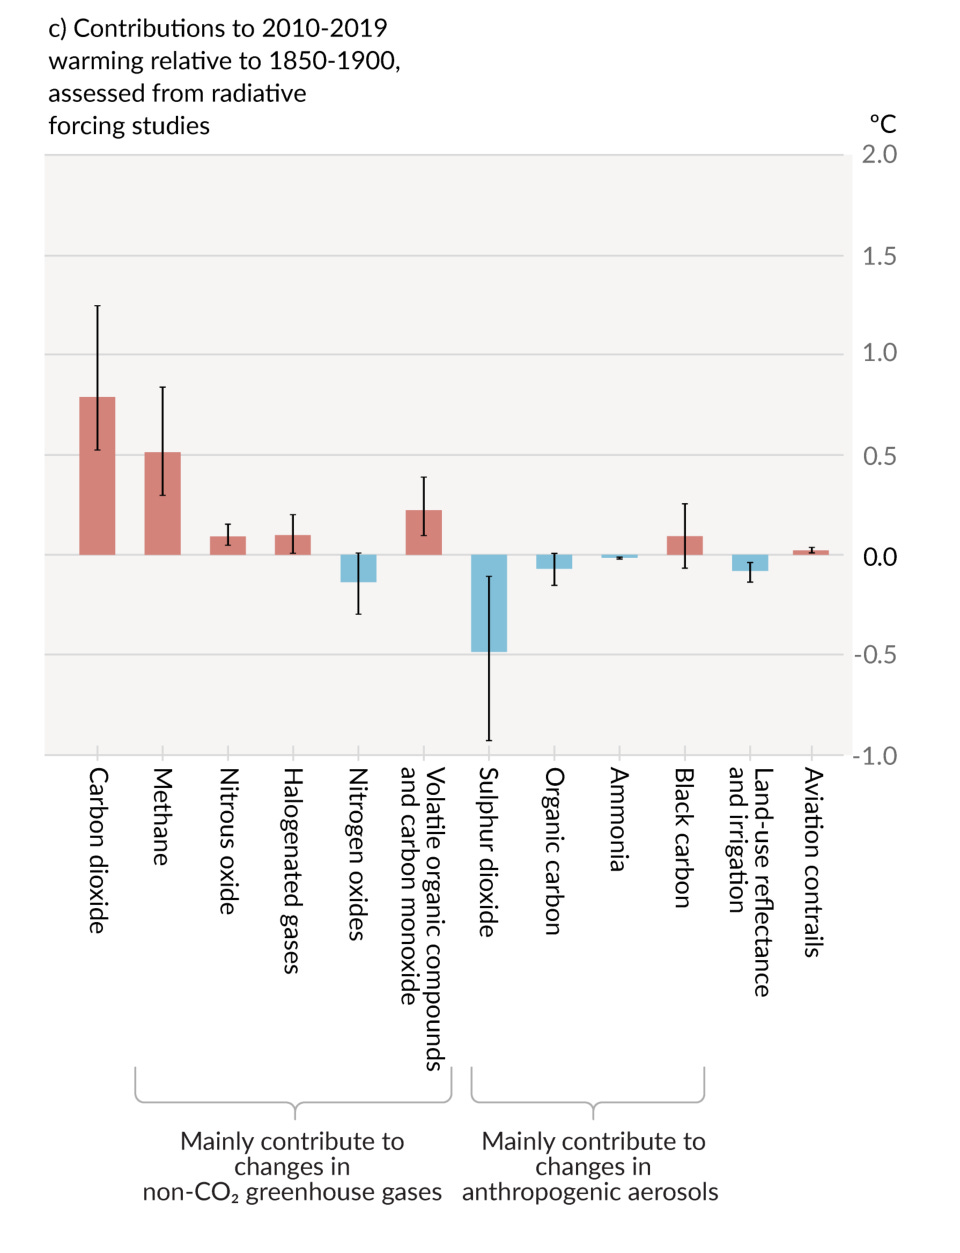
Methane is the second-most emitted greenhouse gas behind carbon dioxide (CO2). Cattle burps and manure are a major source of methane emissions; natural gas leaks and landfills are other prominent sources. Most carbon dioxide emissions are produced by burning fossil fuels.
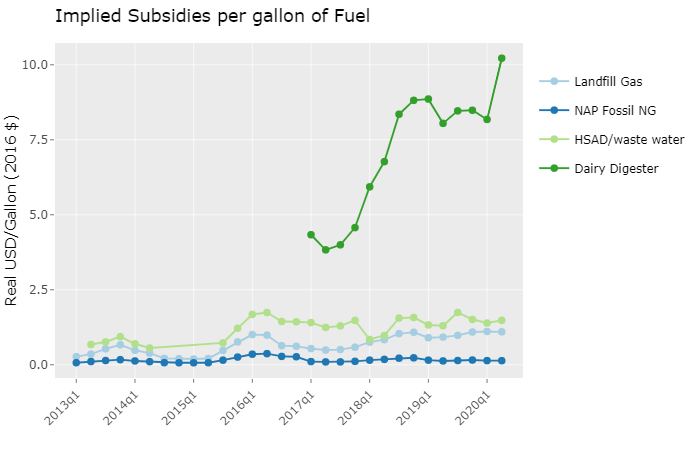
In California's Low Carbon Fuel Standard (LCFS), farmers can earn credits for reducing methane emissions from dairy manure. These credits offset emissions of CO2 from gasoline and diesel. The exchange rate between methane and CO2 is a key parameter in determining the subsidies going to dairy manure.
Methane is much more potent than CO2, but it affects the climate very differently over time. Methane lasts about 12 years in the atmosphere, whereas CO2 lasts for centuries.
To illustrate the difference and why it matters, imagine logs on a campfire. A ton of methane is like a small log that burns really hot for a short time before the flames go out. Residual embers will keep throwing out a little heat after the flames go out, but most of the heat comes early. CO2 is like a large log that burns steadily all night; it produces a consistent low heat.
To compare the two logs, we could come up with a single number to measure their heat potential. One possibility is to add the total heat generated from the each log throughout the night. Call this statistic the Campfire Warming Potential (CWP). The CWP doesn't account for when the heat is generated, so two logs with the same CWP would give a very different experience for someone sitting by the fire.
If you put a methane log on the fire instead of a CWP-equivalent CO2 log, your companions may appreciate you initially, but they will be more and more upset with you as the night goes on.
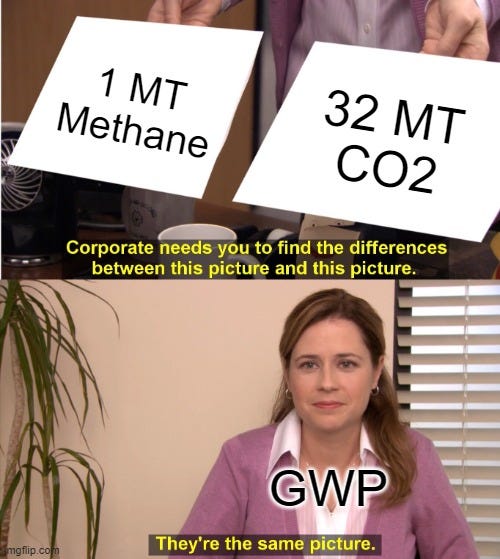
This is what scientists typically do to compare methane and CO2. They sum the change in radiative forcing (think temperature increase) over 100 years caused by emitting one ton of each gas. This is known as Global Warming Potential (GWP), and it implies that a ton of methane emissions is equivalent to between 28 and 36 tons of CO2.
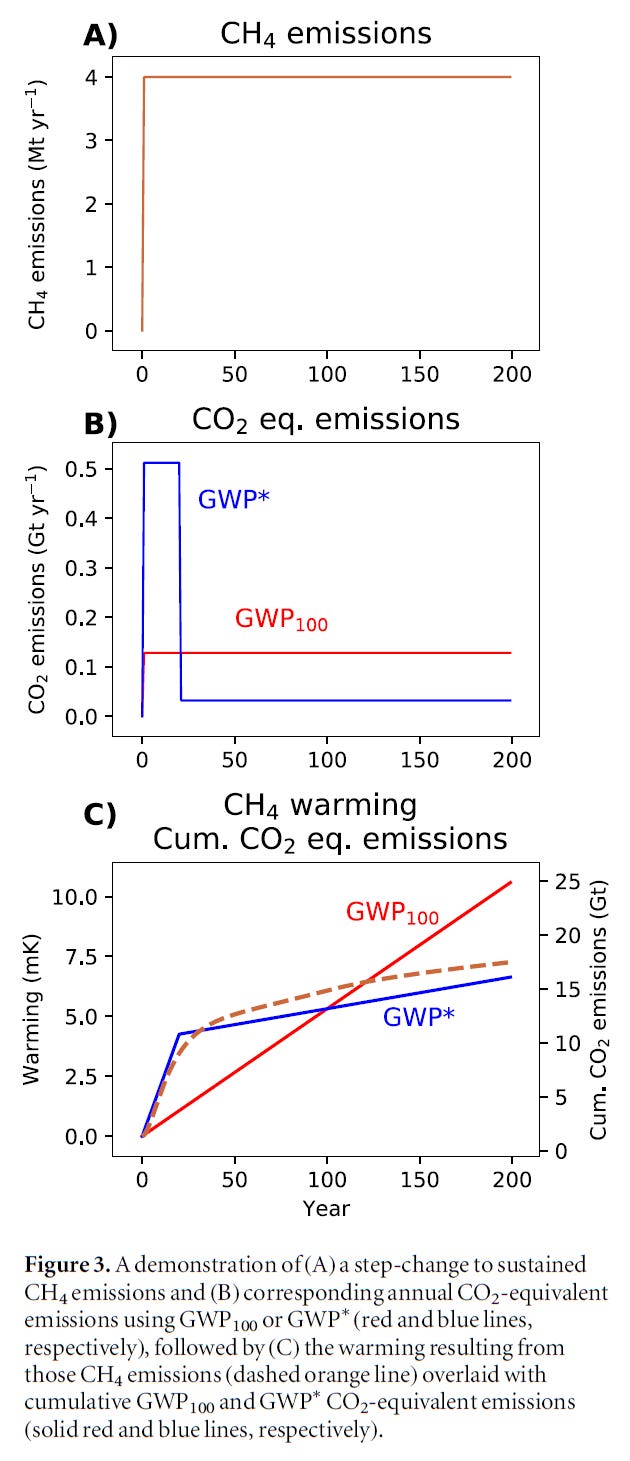
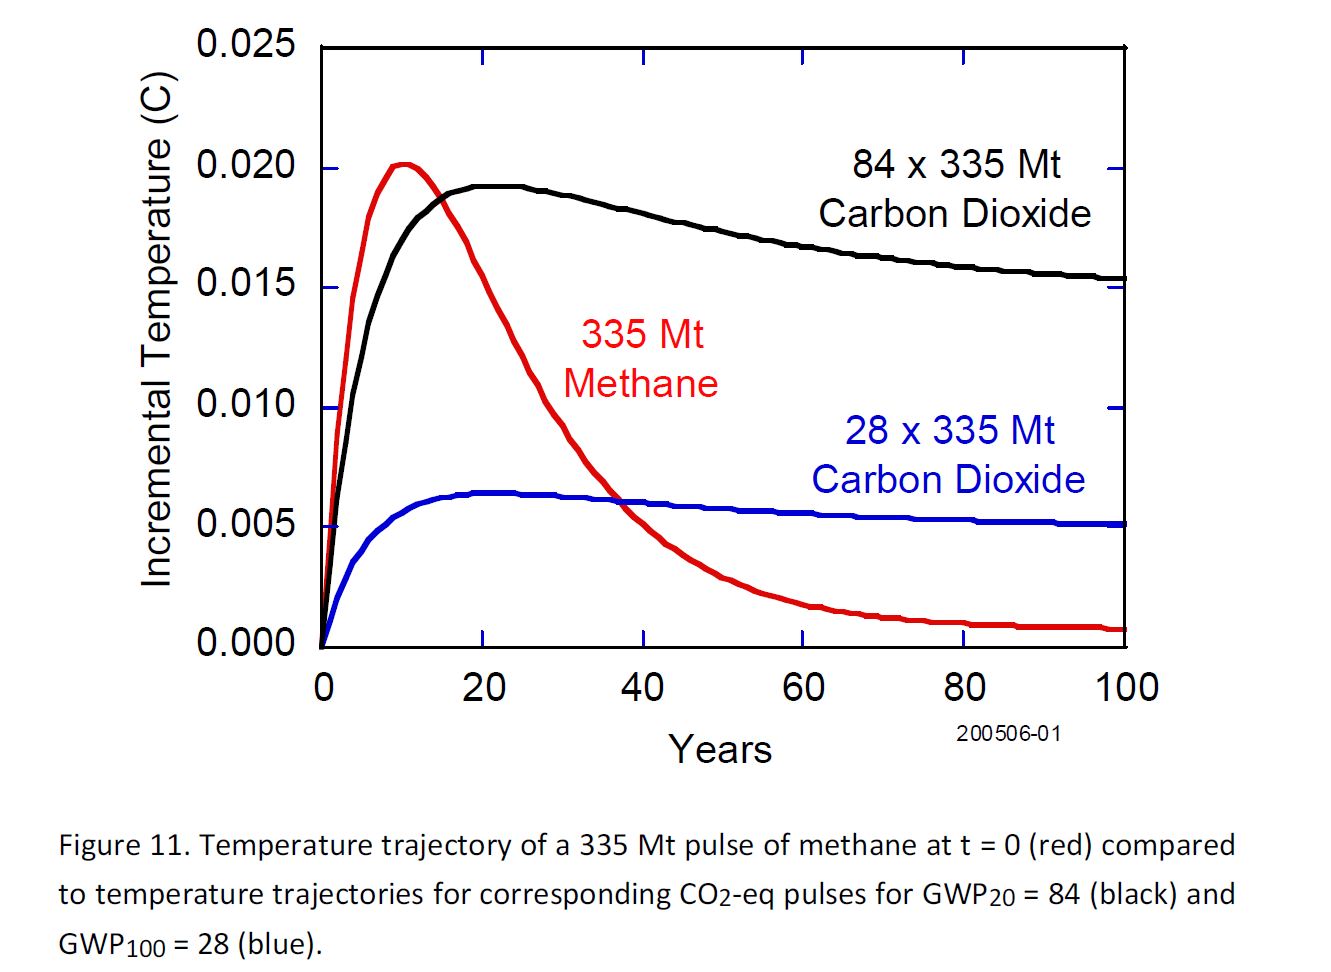
The blue and red lines below have the same GWP, but methane emissions are about 4 times larger than the CO2 equivalent at the 10-year mark and at least 75% smaller after year 70. Thus, reducing current methane emissions will have a big effect on temperatures in the next 20 years, but very little impact on the temperature in 100 years and beyond.
These differences matter. Climate change is already affecting us (as I look outside at the smoky sky), but the biggest effects are yet to come. Reducing today's emissions by a ton of methane instead of 32 tons of CO2 is not a good trade. In more technical terms, I think the damage function is convex and the right discount rate is low.
One path towards a better exchange rate could be to use GWP at a longer horizon, say 300 years instead of 100 years. Another possibility is to equalize the gases based on their effects on temperatures several decades in the future, say years 80-100. Based on the graph above, this approach would imply a 75% lower CO2-equivalent value than currently used. It would reduce LCFS subsidies for biogas from dairy digesters by 75%.
A better way forward may be to compare like with like: one-time changes in CO2 emissions vs permanent changes in methane emissions. Using the campfire metaphor, the heat generated throughout the night by a carbon log is similar to the heat from adding a tiny methane log every few minutes throughout the night, so that's the best way to compare them.
In a 2016 paper in Nature, Myles Allen and co-authors argue that this is a simple calculation. Just take the GWP-equivalent emissions and spread them evenly over 100 years. So, the 100-year warming trajectory from a metric ton of CO2 emissions today is similar to emitting 1/3200 = 0.0003125 metric tons of methane annually (using a GWP of 32).
Ideally, farmers would earn LCFS credits based on a commitment to reduce methane emissions for 100 years, rather than separately for each ton. These credits could be issued at the full exchange rate of GWP/100 for each of the 100 years. That isn't feasible because no-one farms for 100 years. To the extent the commitment to reduce methane emissions is shorter, the exchange rate could be lowered.
Now, the math is a bit more complicated than this because it takes a couple of centuries for the warming caused by methane to level off. In the campfire analogy, the embers that remain after the flames go out continue putting out a little heat for quite a while. In a 2020 paper in Environmental Research Letters, John Lynch and co-authors study a statistic known as GWP*, which accounts for the residual embers.
They show that a permanent 4MT increase in annual methane (CH4) emissions has an equal warming effect to a 20-year increase in CO2 emissions of 512MT per year, followed by permanent CO2 emissions of 32MT per year above baseline. This makes the theoretical ideal policy more complicated, but the principles remain intact.
The IPCC recognizes the drawbacks of GWP on pages 122-123 of Chapter 7 in its report, where it emphasizes GWP* as a better representation of how methane compares to CO2. The panel had used the 100-year GWP in prior assessment reports. It is clear that the 100-year GWP over-emphasizes near-term climate effects and therefore overvalues current methane emissions reductions. The LCFS, which uses a GWP of 25, would be improved by a re-assessment of the exchange rate between methane and CO2.
Another example. What permanent decrease in beef cattle numbers would be the same as taking a car off the road for a year?
According to this nifty calculator, an average car uses 517 gallons of gasoline and generates 4.6 metric tons of CO2. Using a GWP of 32, the GWP-equivalent emissions are 0.14 metric tons (316lb) of methane. Spreading these over 100 years gives us 3.16lb of methane per year. Using numbers from a previous Ag Data News article, a typical 3-year old steer produces about 500lb of beef and belches about 660lb of methane and emits another 66lb from its manure in its lifetime.
So, 12,000 miles driving is equivalent to 3.16/(660+66) = 0.44% of a steer, or about 2.2lb of meat per year for 100 years.
What is the IPCC? The IPCC was created in 1988 to inform governments about climate science, and it released its first assessment report (AR) in 1990. The panel is divided into three Working Groups, each populated by highly-renowned scientists. "Working Group I deals with The Physical Science Basis of Climate Change, Working Group II with Climate Change Impacts, Adaptation and Vulnerability and Working Group III with Mitigation of Climate Change." This week's assessment report was the sixth from Working Group 1, i.e., this is AR6 from Working Group I. The other two working groups will each release their AR6 reports in 2022.
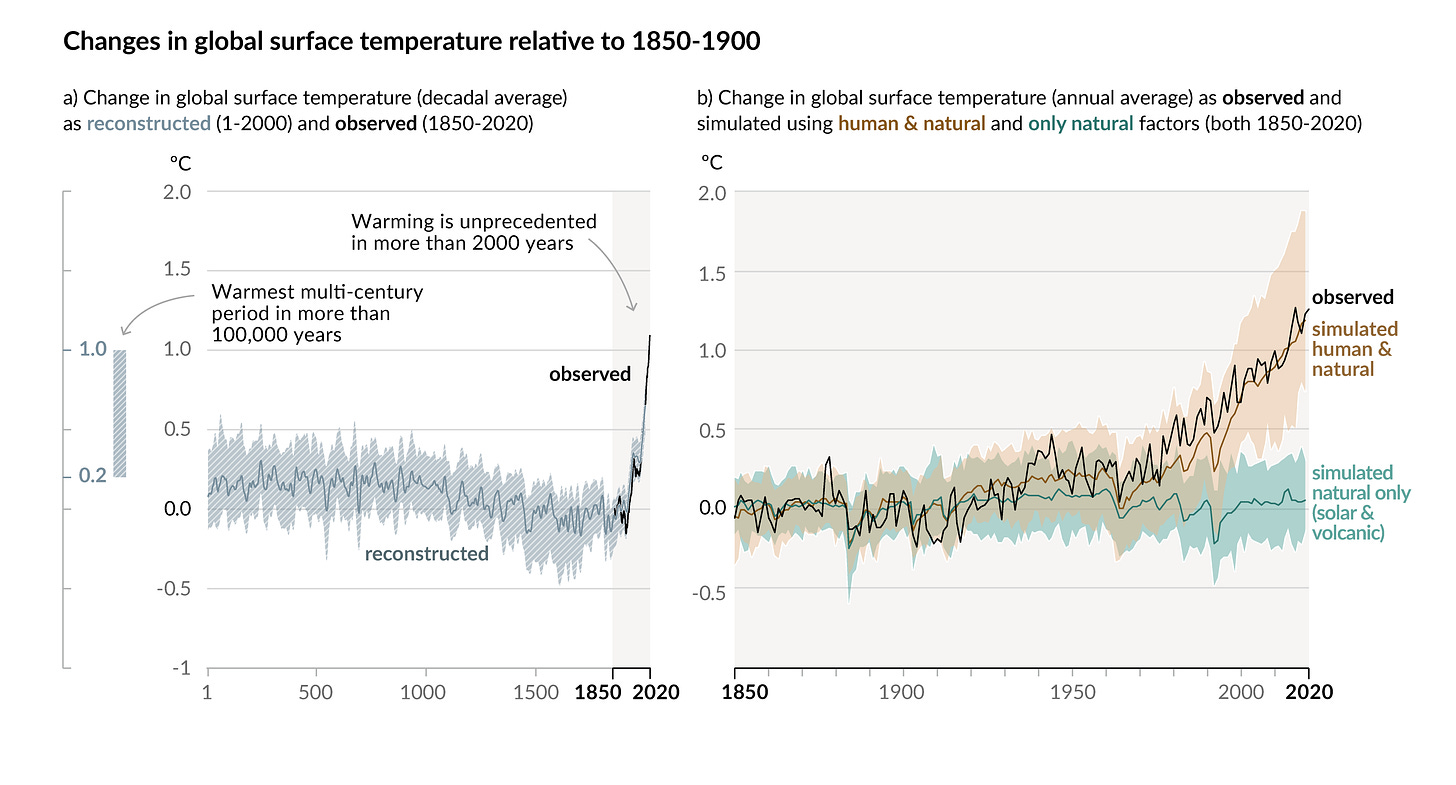
What did the 2021 report say? Mostly, the report restates what we already know, but with more confidence. The average global temperature in 2010-2019 was 1.1°C higher than the 1850-1900 average. This change was caused by human activity, principally greenhouse gas emissions from burning fossil fuels. By the end of this century, the average temperature will likely increase by another 2-3°, but the temperature rise could be less if the world cuts fossil fuel use dramatically or more if we go on a coal-burning spree.
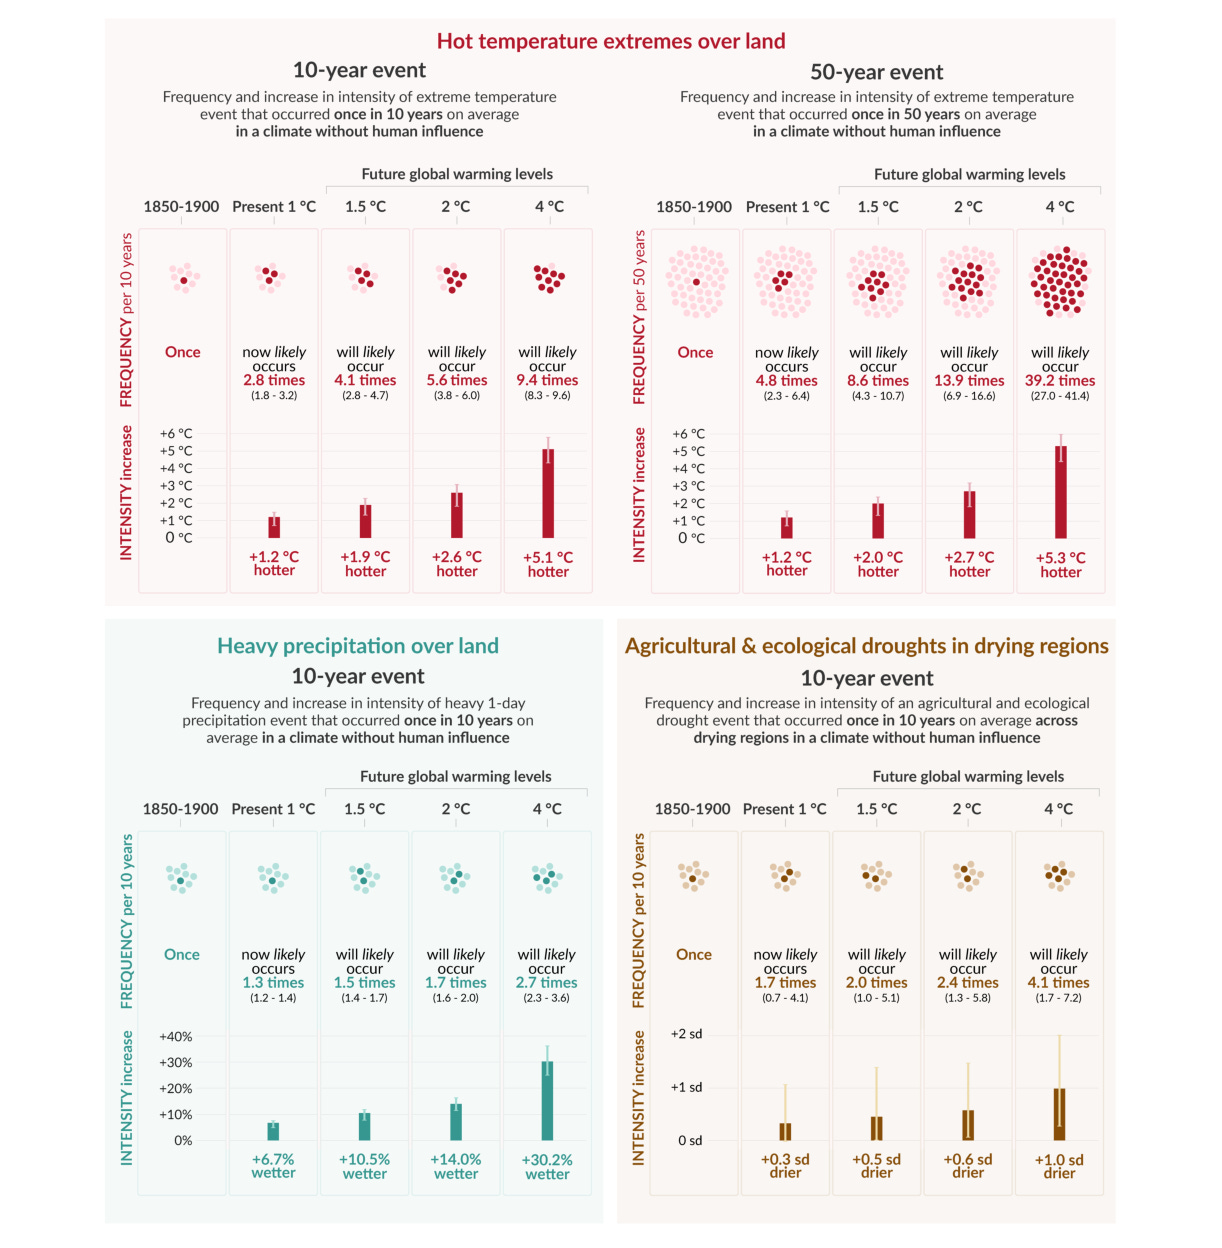
The damage from climate change comes not from the increase in average temperatures, but increases in the extremes. Extreme heat, floods, and droughts have become more frequent as the climate has changed, and scientists project they will increase further as the climate warms.
Subscribe to Ag Data News
Agriculture, Economics, and Data


