I have often found myself in a Google doom loop searching for data I know is available. I just don't know where to find it in a convenient form.
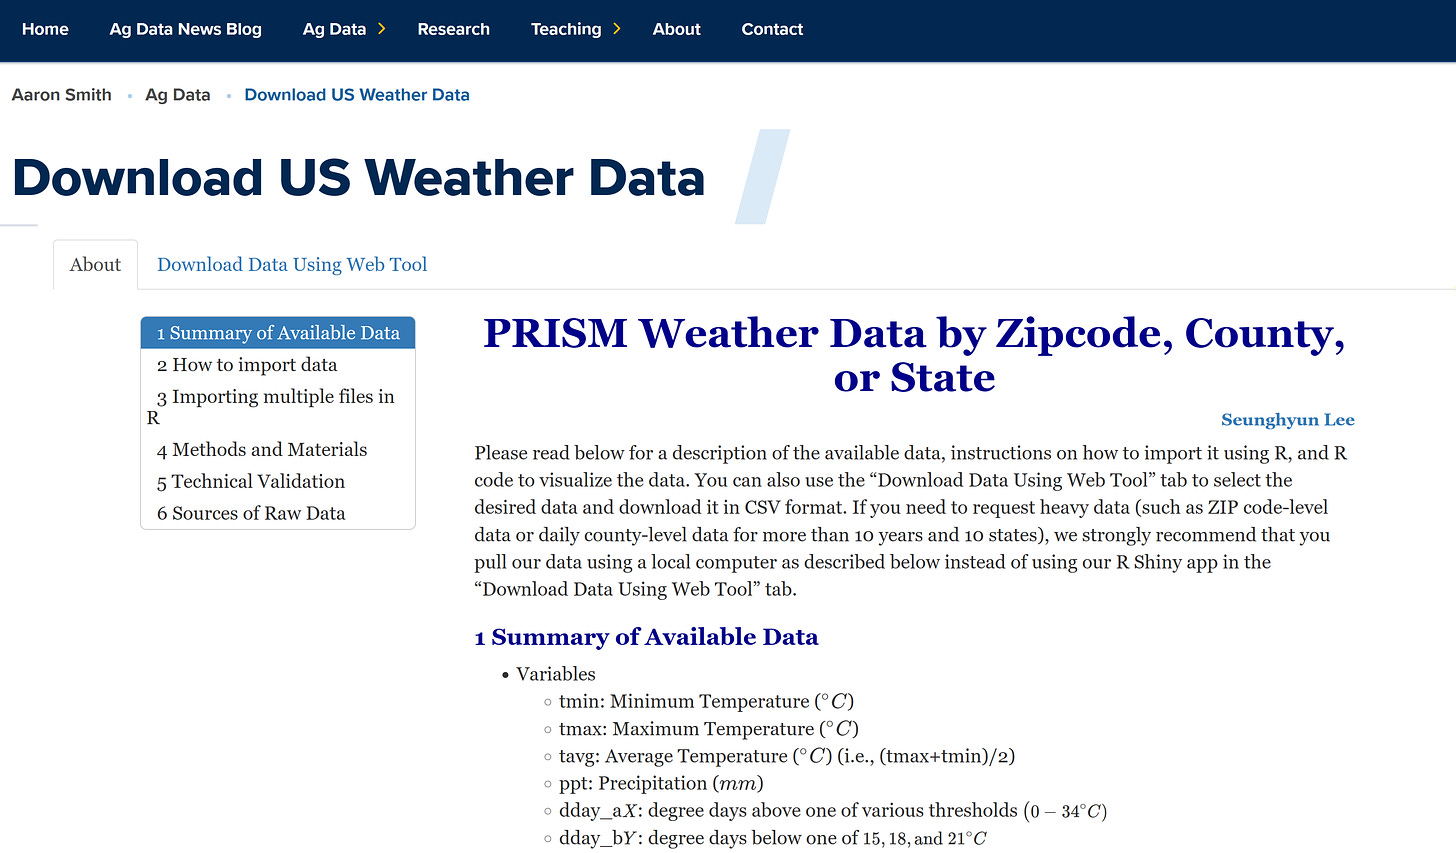
This week, we are launching a new web app you can use to easily download United States weather data by zipcode, county, or state. The data include precipitation, minimum and maximum temperature, average temperature, and various degree day variables.
Want daily cooling degree days by zipcode? We have that.
Want monthly cropland-weighted growing degree days by county? We have that too.
Want population-weighted average daily average temperature by state? You guessed it; we have that.
This article describes how to access the data, using the current drought in Kansas as an example. (Scroll down if you want to go straight to the Kansas drought.)
The data come from the PRISM Climate Group at Oregon State University, which "gathers climate observations from a wide range of monitoring networks, applies sophisticated quality control measures, and develops spatial climate datasets to reveal short- and long-term climate patterns. The resulting datasets incorporate a variety of modeling techniques and are available at multiple spatial/temporal resolutions."
PRISM makes data available for free at the 4km resolution. We downloaded those data and aggregated them temporally and spatially into datasets we hope are useful for researchers and others curious about the weather. (All the code is available here.)
Some details on coverage:
Geographic Coverage: the contiguous United States
Time Period: 01/01/1981 - Present (updated on the 2nd of every month)
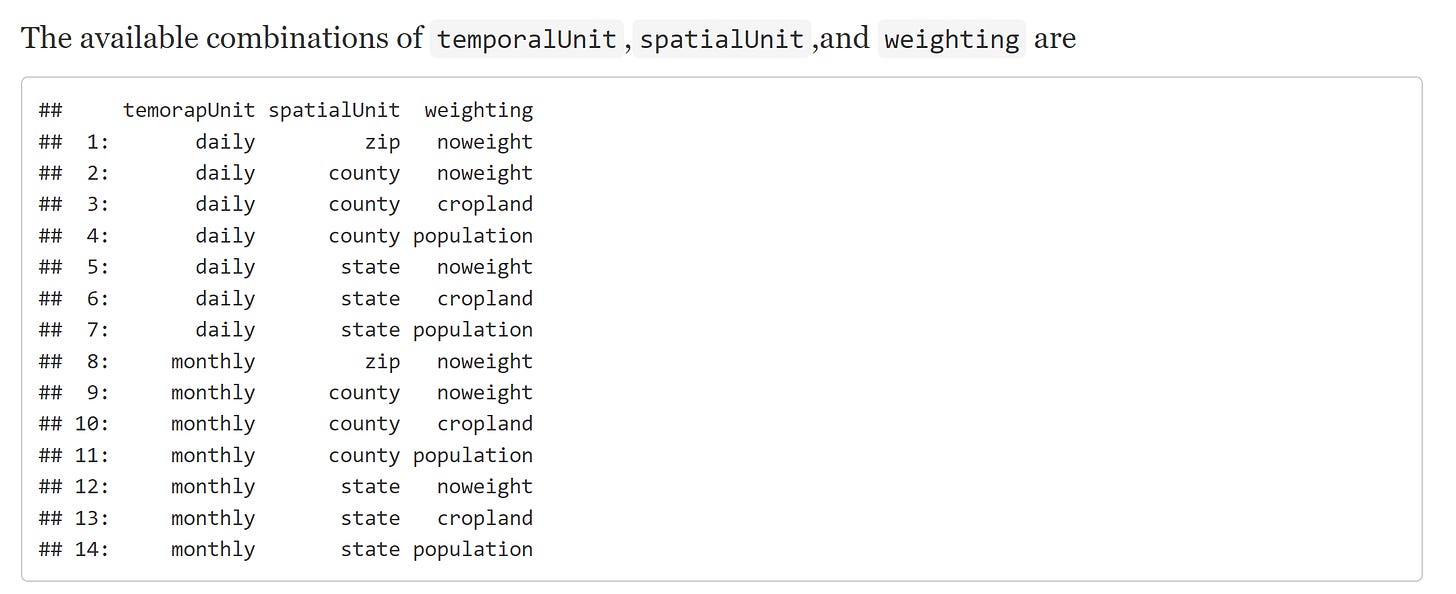
We organized the data into separate files by year and month. For a given year/month, we have all combinations of the following three variables:
Temporal Unit: Daily, Monthly
Spatial Unit: ZIP code, County, State
Weighting Scheme: No Weight (i.e., simple average), Cropland, and Population. (See Methods & Materials for details. No weighting scheme was applied to ZIP code-level data because weighting makes little difference.)
We provide three methods for downloading the data:
Specify the temporal unit, spatial unit, and weighting scheme. Then go to this URL for each year/month you want: https://files.asmith.ucdavis.edu/weather/temporalUnit/spatialUnit_weighting/yyyymm.csv
Import into R using the sample code we provide.
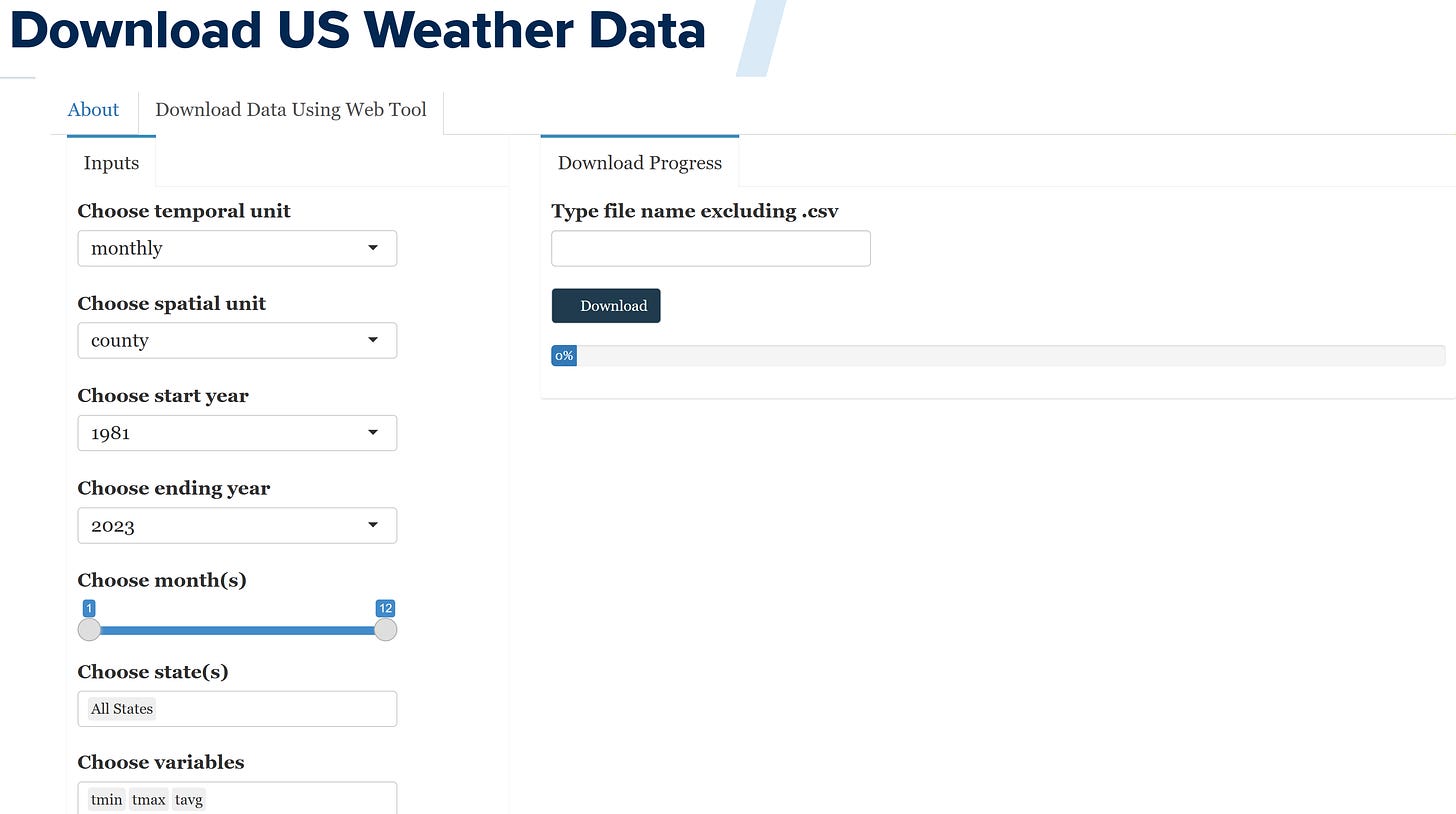
Use our web tool to select the desired data by pointing and clicking, before downloading it in CSV format.
Here's what our web tool looks like. We strongly recommend that you use this tool only if your request is not too heavy (e.g., don't use it for ZIP code-level data or daily county-level data for more than 10 years and 10 states). For heavy data requests, it is better to import directly into your data analysis software (e.g., using the sample R code we provide in the app).
Example: Kansas in Drought
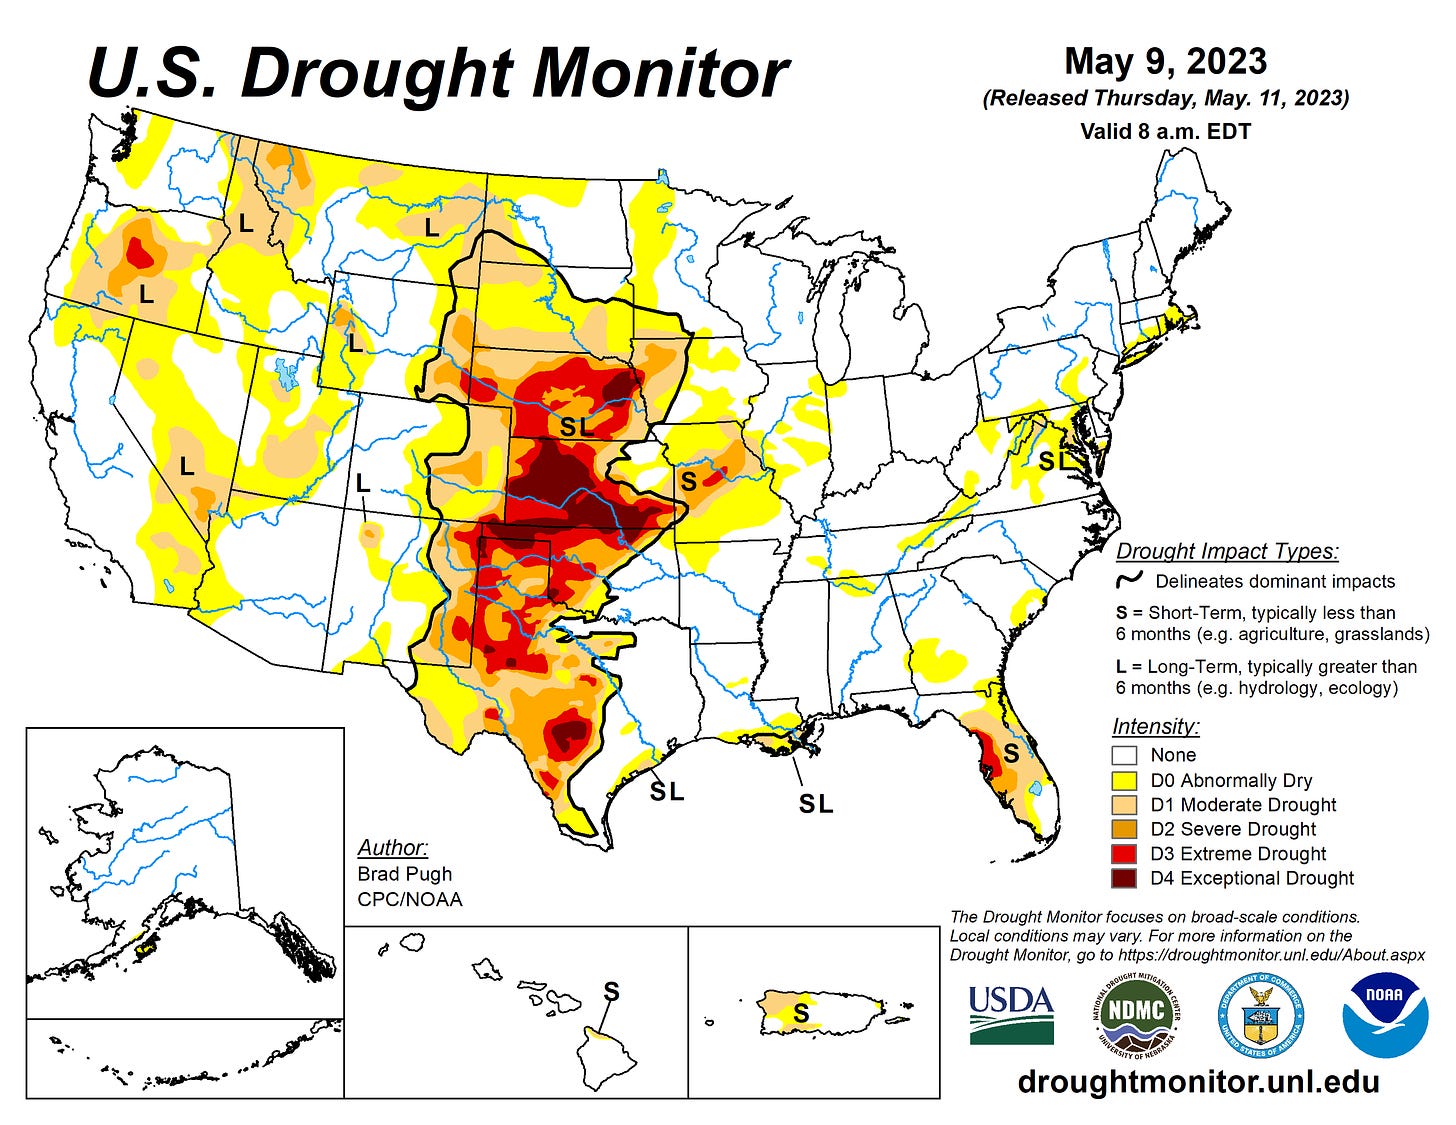
Most of Kansas is in the middle of a severe or exceptional drought. Kansas is the largest US producer of winter wheat. What will this do to the 2023 Kansas wheat crop?
The best recent weather year for Kansas wheat was 2016, when it reached a record 57 bu/ac. Two years earlier, the yield had been 28 bu/ac, which was the worst year since 1995. More recently, 2021 produced relatively high yields and 2022 relatively low yield.
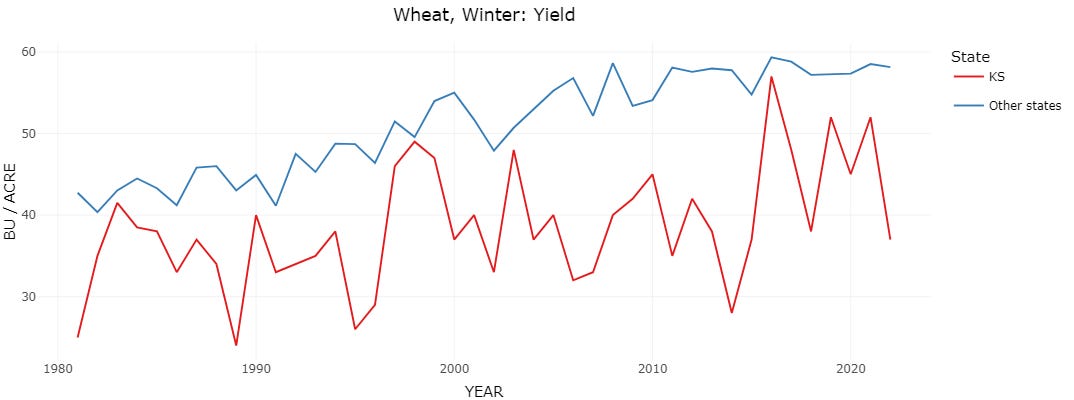

Winter wheat is planted in the fall, lies dormant over the winter and is harvested in the early summer. In the high-yield years of 2016 and 2021, Kansas got a substantial about of rain in March and April. In the low yield years of 2014 and 2022, the state received relatively little rain in March and April. This year looks a lot like 2014 from a precipitation standpoint.
I made the maps below using the suggested R code in our web app (my R script is here).

Kansas doesn't get many hot days in March and April. It saw essentially no days above 29°C in 2016, the record high-yield year. In 2023, the state saw more degree days above 29°C than in the low-yield years of 2014 and 2022.

Avoiding extreme heat in May is an important key to a high-yielding crop. In both 2016 and 2021, the state saw almost no days above 29°C in May. May precipitation appears less related to yield, as 2016 produced high yield despite being quite dry, especially in the western part of the state. That said, western Kansas had a very dry March and April this year, so the wheat crop probably needs some May rains.


Kansas is in a serious drought. USDA reports show that only 30% of the winter wheat crop is in good or excellent condition, a statistic that is usually above 50% at this time. Unless the state avoids high temperatures this month, wheat yields are likely to be quite low this year.
This project was inspired by Wolfram Schlenker, who provides Stata code and raw weather data for constructing cropland-weighted county-level weather data for the Contiguous US for 1950-2019. However, due to the need to make various decisions when constructing these data, our results and Wolfram’s data are not always identical. In the Technical Validation section of the tool, we compare our data to Wolfram's.
The tool was created by Seunghyun Lee, an outstanding UC Davis PhD graduate who has been working with me as a postdoc since finishing his PhD last spring. He will start work as an assistant professor at Montana State University in the fall. Seunghyun is behind a most of the data tools on my website. He is phenomenal and will be a huge asset to Montana State. Thank you Seunghyun.


