Do We Have an Elastic Product?
Twenty years ago this week, the tv show "The Wire" premiered on HBO. It is, in my opinion, one of the best shows ever made.
One reason I liked it --- not one of the main reasons, but a reason nonetheless --- was that drug kingpin Stringer Bell went to night school to take economics classes. Several times in the series, the viewers and other characters benefit from his acquired wisdom.
Stringer ran a copy shop as a front for laundering drug money, but he also wanted it to be a profitable business. In this clip, he explains to his employees how their copy services are an "elastic product." A small increase in price or a drop in the quality of service will cause their customers to go elsewhere.
How do you know if demand is elastic?
This is an important question in many contexts. We need the answer to estimate how much grain the world lost when Russia invaded Ukraine or when a windstorm hit Iowa. We need it to estimate how much extra land was used for corn when the government increased biofuel mandates.
Knowing the demand elasticity also tells us the cost of restricting international trade. If you tax imports of food or energy, which have inelastic demand, then consumers will pay the tax because they can't easily cut back on consumption. The tax makes them much worse off. However, if you tax imports of goods with elastic demand, then consumers will use their money to buy something else they like almost as much. They are not much worse off.
More on elasticities for imported goods soon.
But, first, how do you know if demand is elastic?
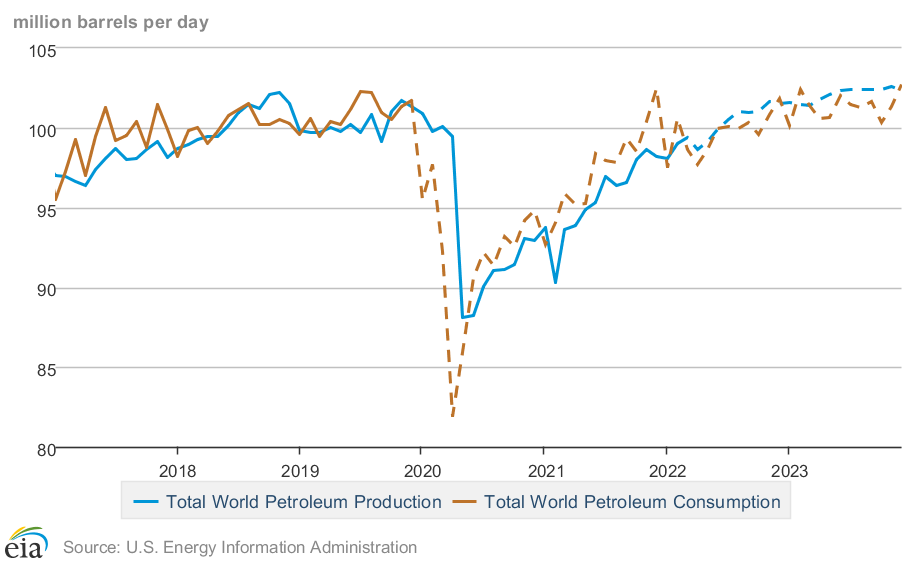
Answer: it's difficult, even if you have a lot of data. For example, suppose the price of oil increases and the quantity used doesn't change much. Does this mean oil demand is inelastic? Or is oil supply inelastic? Or both? Or neither?
The answer depends on what caused the price change.
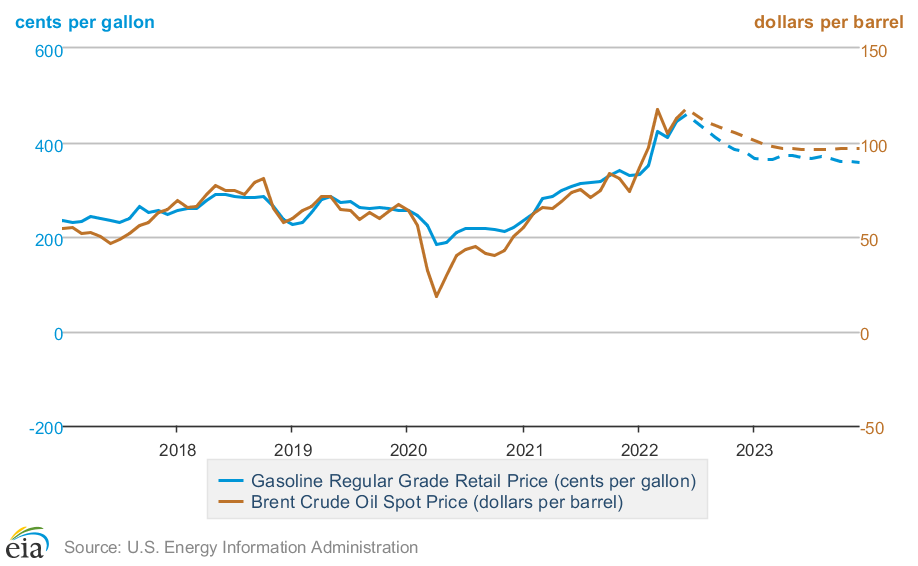
If Russia invading Ukraine made it more expensive to get oil to market, then we can estimate the elasticity of demand by looking at how much consumers cut back when faced with the higher prices.
However, if exiting the pandemic caused people to want to drive more, which in turn pushed the price up, then we can estimate the elasticity of supply by looking at how much more oil that producers pump in response to higher prices.
If both things happen at once then you don't know whether the change in quantity reflects the response of consumers or producers. Similarly, if you're studying prices over a longer period of time, then you will have a mix of prices changes caused by producers and price changes caused by consumers, which means that the correlation between price and quantity doesn't tell you much about the elasticity of supply or demand.
This brings me to a paper that Shon Ferguson and I published in the Canadian Journal of Economics this week. We tackle the problem of estimating demand elasticities for imported goods.
When a researcher sees the prices of imported goods change, it is typically hard to know whether the cause is something external that consumers will respond to, or whether the price changed because consumers changed their demand.
One way around this problem is to change our goals. Rather than trying to estimate the demand elasticity, we try to find a range of plausible elasticities. We want to say the elasticity is greater than this number and less than this number.
Shon and I develop a method to estimate a range of plausible elasticities and use it to estimate elasticities for hundreds of products imported into the US. We obtain lower elasticities than previous studies. We use them to calculate that trade is twice as beneficial for consumers as previous estimates would imply.
That means restricting international trade is twice as bad. Don't do it.
More details on our paper for those who are interested.
We draw on a paper published by Ed Leamer in 1981 entitled "Is it a demand curve? Or is it a supply curve?" Leamer discovered that if you look at the problem from both sides, you can discover the upper and lower bounds. Specifically, predict how much quantity tends to decrease when prices increase; your answer is the smallest value the elasticity could be. Then, predict how much price tends to decrease when quantity increases; your answer is the smallest value the inverse elasticity could be, i.e., it is the largest value the elasticity could be.
In short, regress quantity on price and then regress price on quantity.
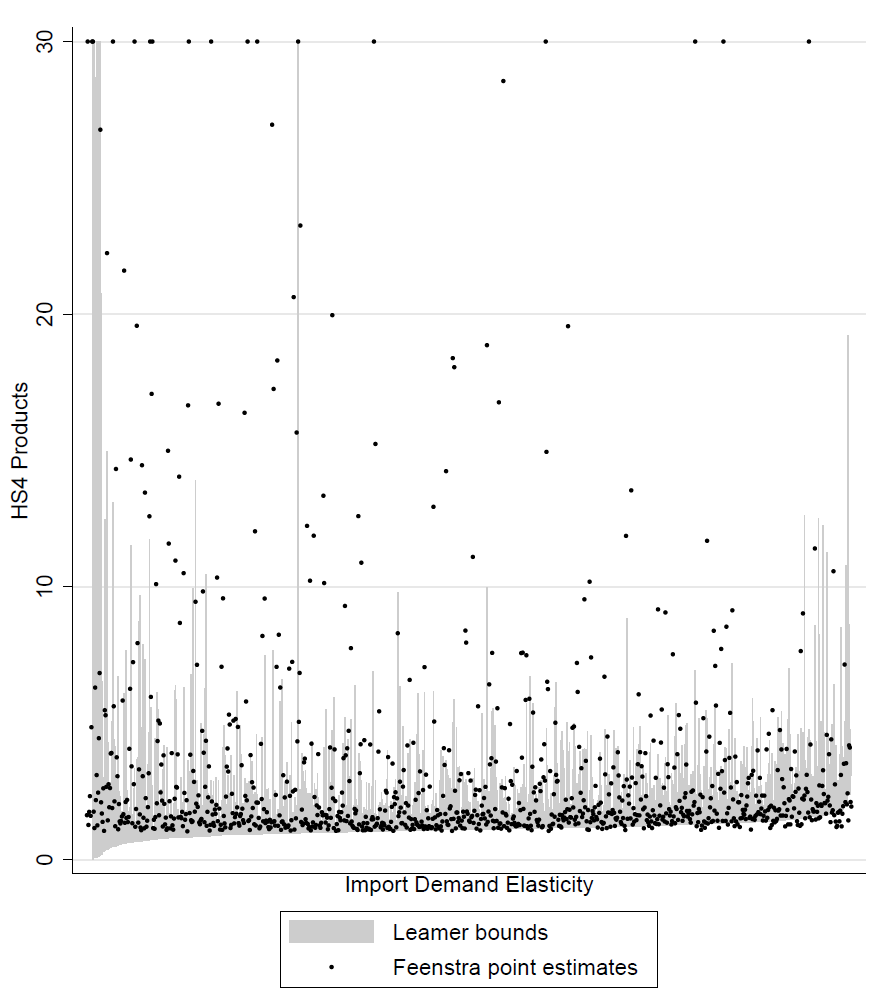
Here are import demand elasticity estimates for several hundred products defined at the "4-digit HS" level. For example, coffee is one of these products, so this classification is more granular than "beverage", but less specific than "decaffeinated". For most commodities, the elasticity ranges between 1 and 3, as indicated by the "Leamer Bounds" shaded region in the plot. The standard method, indicated by "Feenstra point estimates", typically produces elasticities above our estimated range.

Trade economists often estimate elasticities by relating the value of traded goods to the price rather than relating quantity to price. We show that the range of plausible elasticity estimates is much smaller when using traded quantities in place of trade values. These results hold up in the presence of measurement error in the data, unless the measurement error is substantially more severe in the quantity data than in the value data.

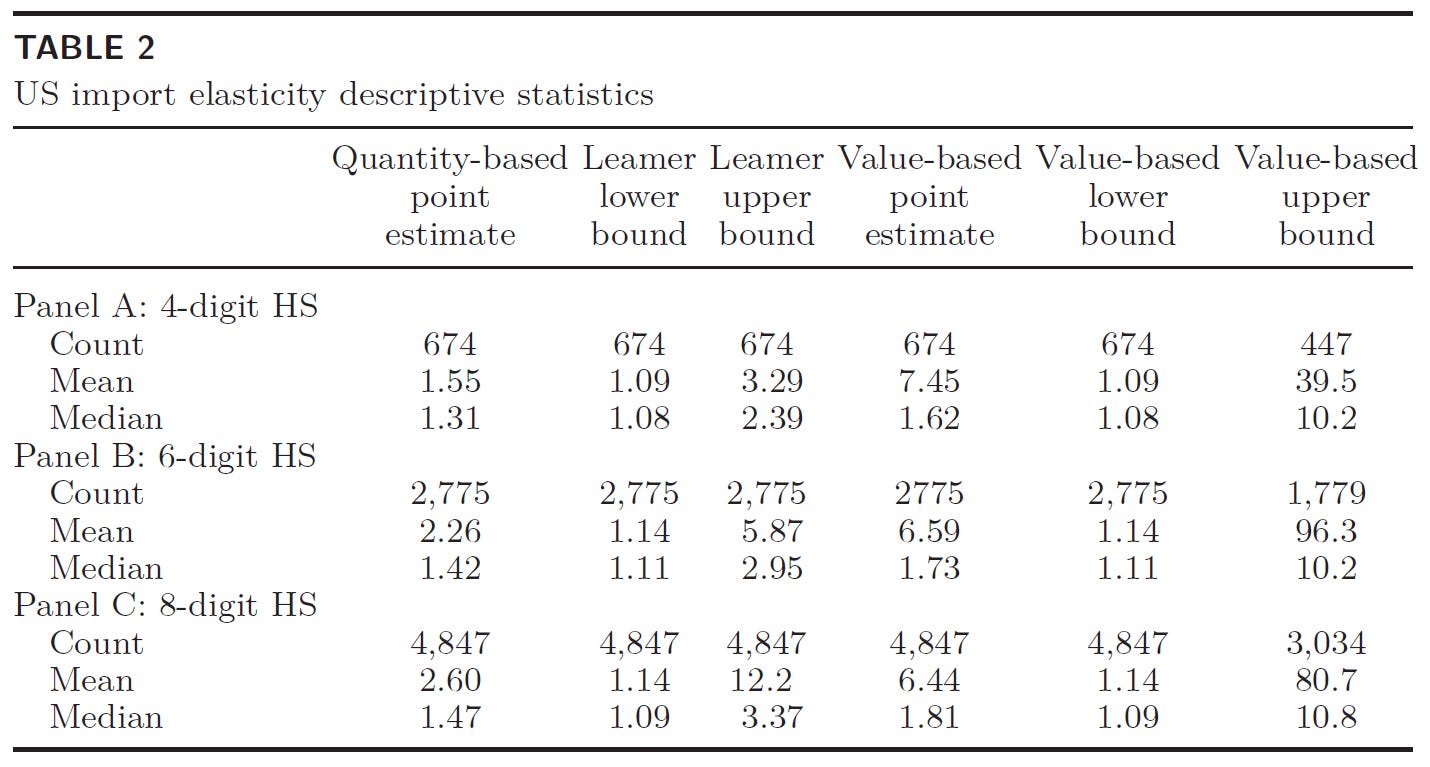
We apply these methods to thousands of commodities. This table summarizes the differences between our estimates based on quantities and standard estimates based on values. We find a narrower range and lower elasticities.


