Ag Data: Where Do I Find It?
The main impetus for my project to make agricultural data more easily available was that I, as someone who spends much of my time working with agricultural data, often found it difficult to find simple pieces of data. I can imagine how tough it is for people new to the field.
Yet, there are reams of data out there, if you know where to look. For example, the USDA is broken into a dizzying array of agencies, including the Agricultural Marketing Service, Economic Research Service, Farm Service Agency, Foreign Agricultural Service, National Agricultural Statistics Service, Risk Management Agency, and more. Those in the know refer to them by their acronyms. Each publishes data on its own website in its own format.
So, we made a new web app that you can use to find agricultural data. We call it: "Where do I find it?"
In this week's Ag Data News, I introduce the app. Please try it and send us feedback.
The new app covers five data types: Production, Consumption, Prices, Natural Resources, and Environment and Climate Change. Here's what is looks like.

From dropdown menus, you may select topics and specify geography or temporal frequency. You may also search for an exact text match.
Suppose I want data on global wheat production. In the production tab, I type the search word "wheat". The app finds exact text matches, so short simple searches are best. Next, I select "Global" geographic scope and the the "Supply" topic from the dropdown menus. This leaves us with 6 entries.
I choose an entry from UN FAO and drill down to see the details. There is a clickable link for each dataset. See the video below.

At the bottom of the app, you can download the parent file containing our list of datasets with one click.
This app was developed by ARE PhD student Andrew Swanson, with Junjun Dong and Oscar Halliwell also contributing to the early stages of development.
Please try it and send us links to all the datasets that we've omitted. We look forward to improving it over time.
In the past two years, I have worked with multiple graduate students to develop web apps using R Shiny that make Ag Data easily viewable and downloadable. To see them all, click here. Popular apps include the Cropland Data Layer for satellite data showing which crop is planted on which field in the US, as well as our California Crops and US Crops apps, all created by Seunghyun Lee.
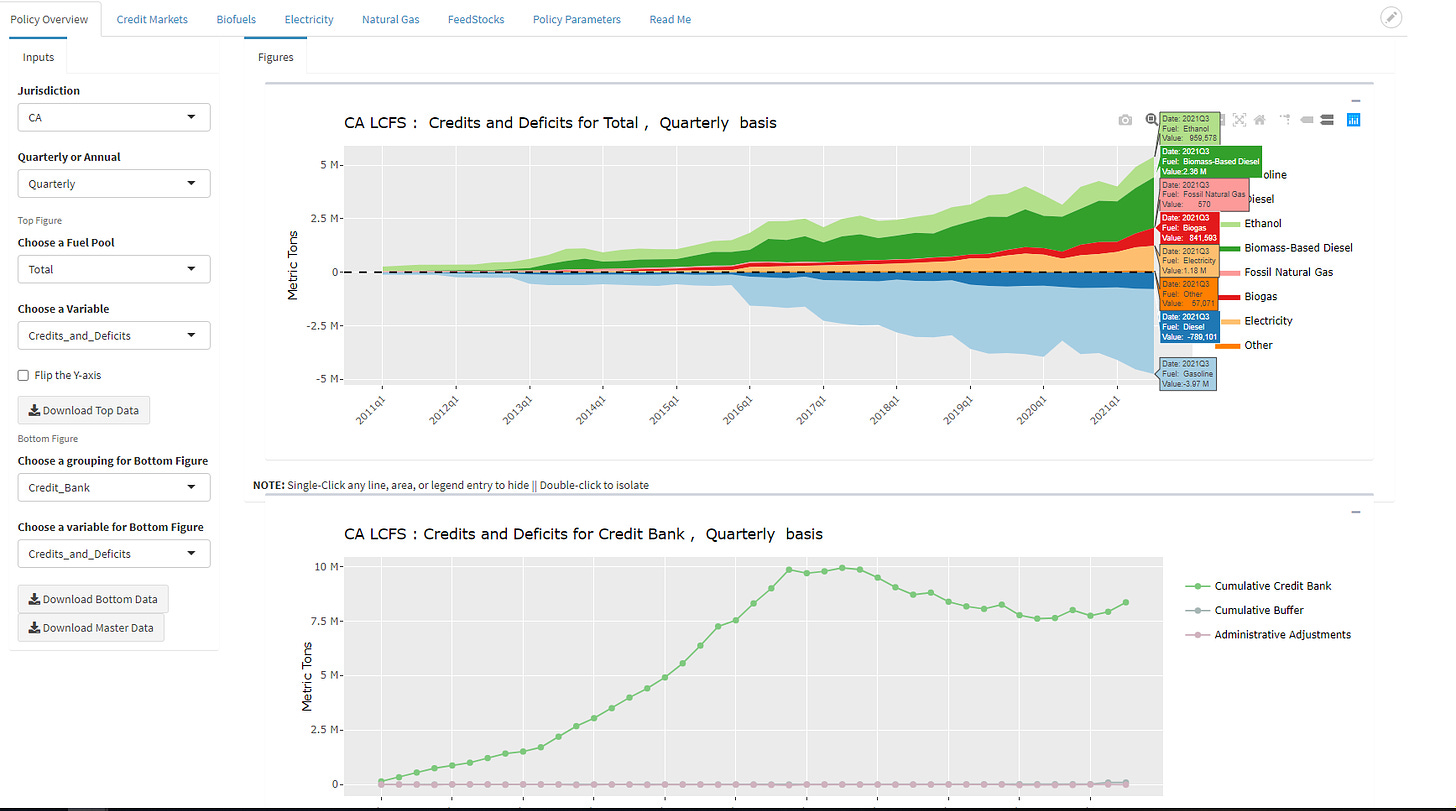
Our most-used app contains data for Low Carbon Fuel Standards, created by Dan Mazzone. It includes detailed data on LCFS programs in California, Oregon, and British Columbia.


