Did the Ag Census Undercount Cropland?
Every five years, the US Department of Agriculture (USDA) conducts a census of farms. The latest census was conducted in 2022 and the data were released earlier this year. As always, it contains a treasure trove of information.
It’s called a census, but not every farmer participates. The 2022 census had a response rate of 61.4%, down from 78.2% in 2007, 74.5% in 2012, and 71.5% in 2017. A declining response rate plagues a lot of USDA data products, and I wonder whether it is compromising the accuracy of census data.
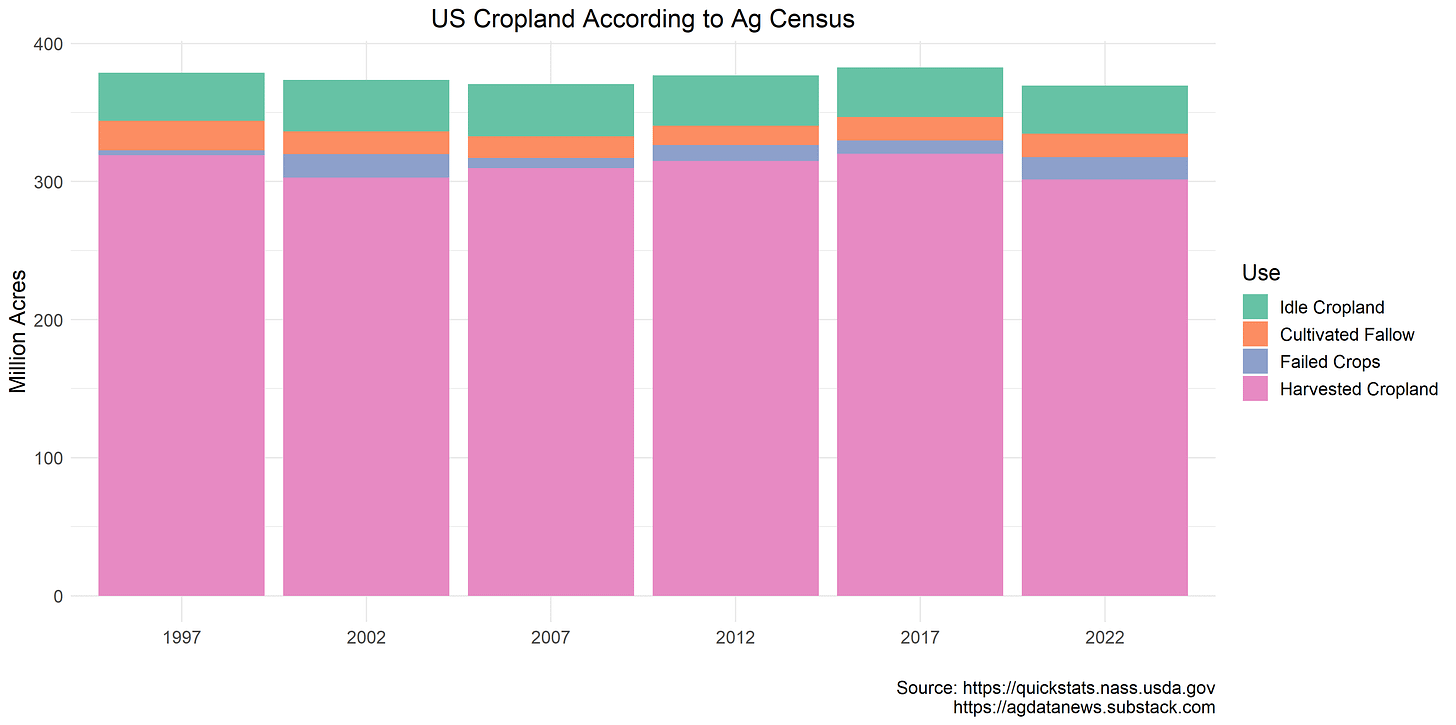
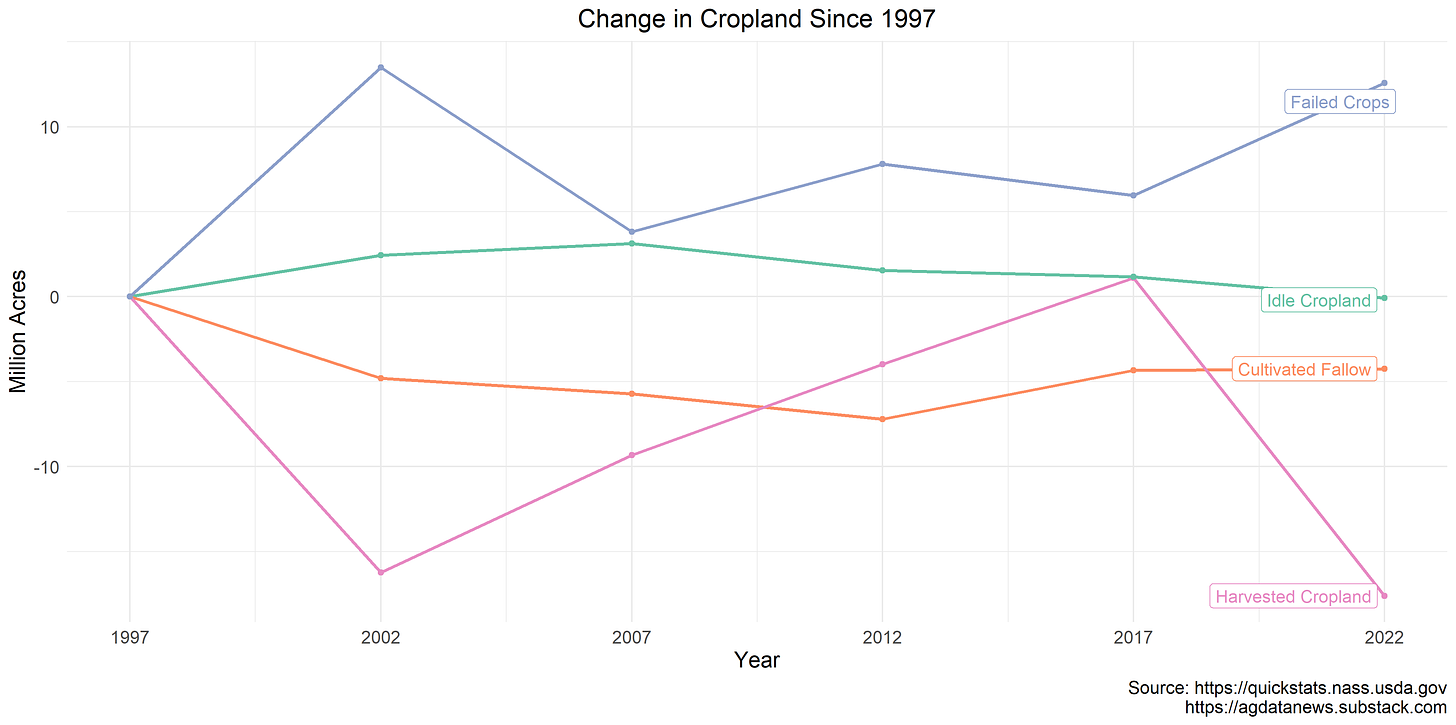
The latest census revealed a 19 million acre decrease in the amount of harvested cropland. In the 15 years from 2002 to 2017, harvested cropland had increased by about 6% from 303 to 320 million acres. In the five years from 2017 to 2022, it gave back all those gains, decreasing to 301m acres.
The census classifies 60-70 million acres as cropland that is not harvested, either because (i) crops were planted but failed, (ii) the fields were cultivated to control weeds and accumulate moisture in preparation to plant crops in a future year (cultivated fallow), or (iii) land that had grown crops in previous years was left idle for physical or economic reasons, including enrollment in Federal conservation programs.
One reason for a decrease in harvested cropland is crop failure. According to the census, there were 6.6 million more acres of failed crops in 2022 than in 2017, which accounts for a third of the decrease in harvested acreage. There were also a lot of failed crops in 2002, which explains most of the drop in harvested acres between 1997 and 2002.
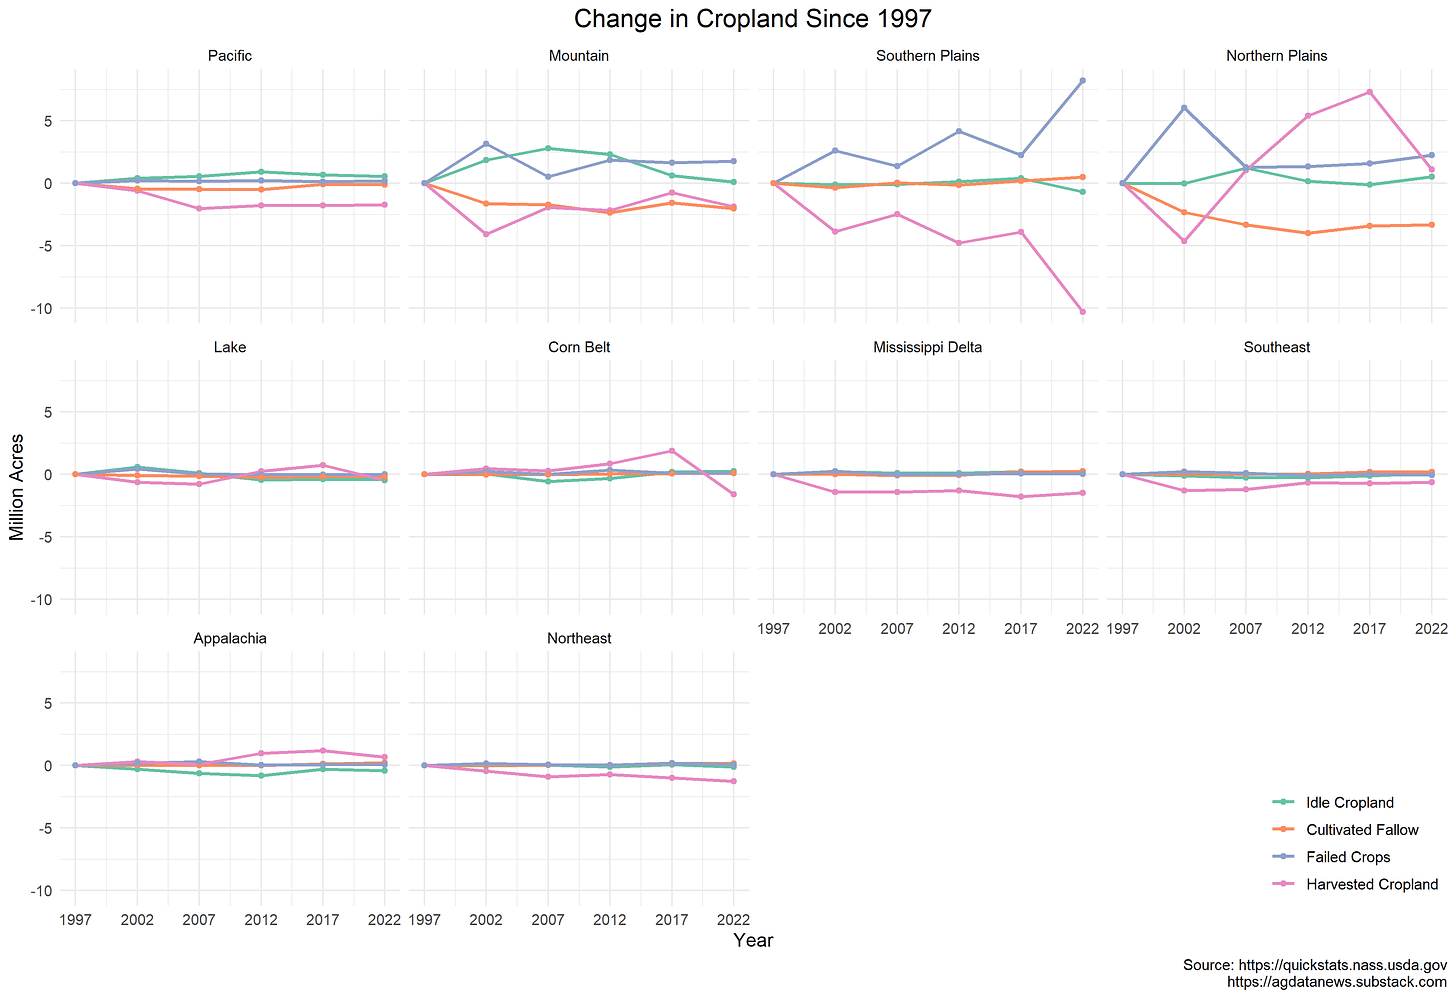
Land use varies dramatically across the country. The largest drops in harvested cropland between 2017 and 2022 came in the Southern Plains (6.4m), Northern Plains (6.2m), and the Corn Belt (3.5m). (Click here to see a map of these regions.) The changes in the Southern Plains are due almost entirely to failed cotton crops. In the Northern Plains and Corn Belt, however, the drop in harvested acres is not due to failed crops.
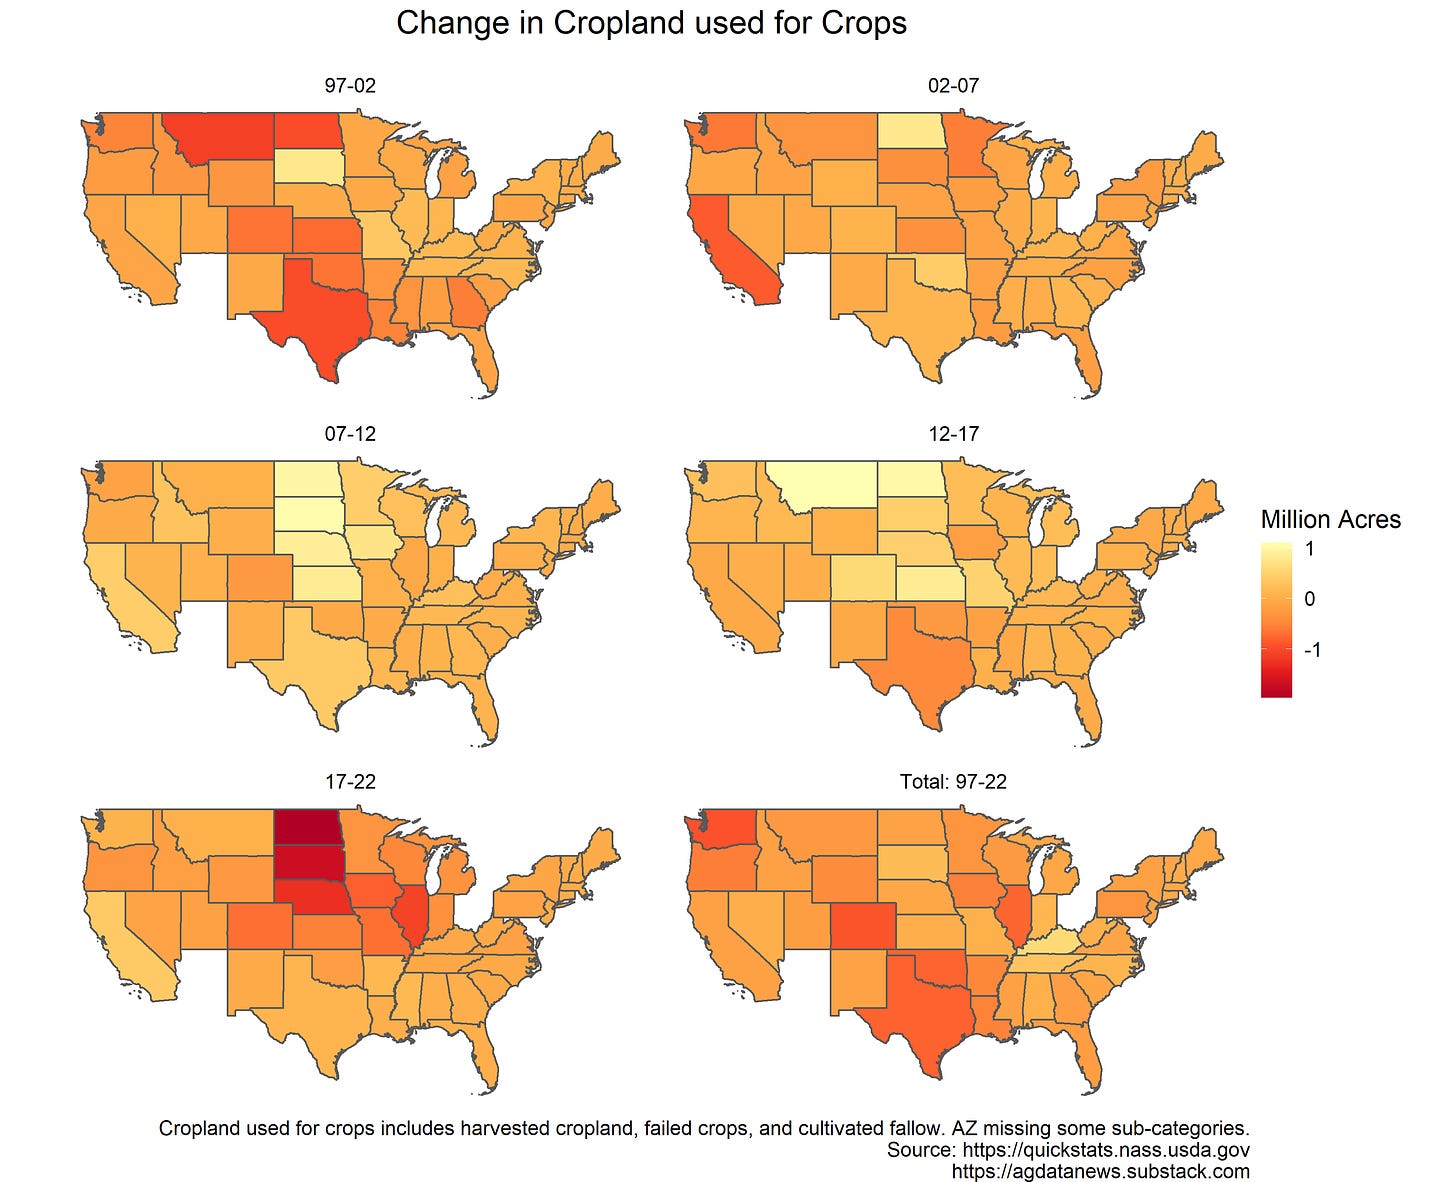
The amount of cropland used for crops increased in the Great Plains states between 2002 and 2007, in large part because of the expansion of biofuel production. This expansion continued at a slower rate in 2007-2012. However, the most recent period saw large drops in cropland used for crops, including a decrease of 2m acres in North Dakota and a million acres each in South Dakota, Iowa, and Illinois.
(In the maps below, I defined cropland used for crops as the sum of harvested cropland, failed crops, and cultivated fallow.)
Why does the census show such a large decrease in cropland in these four states?
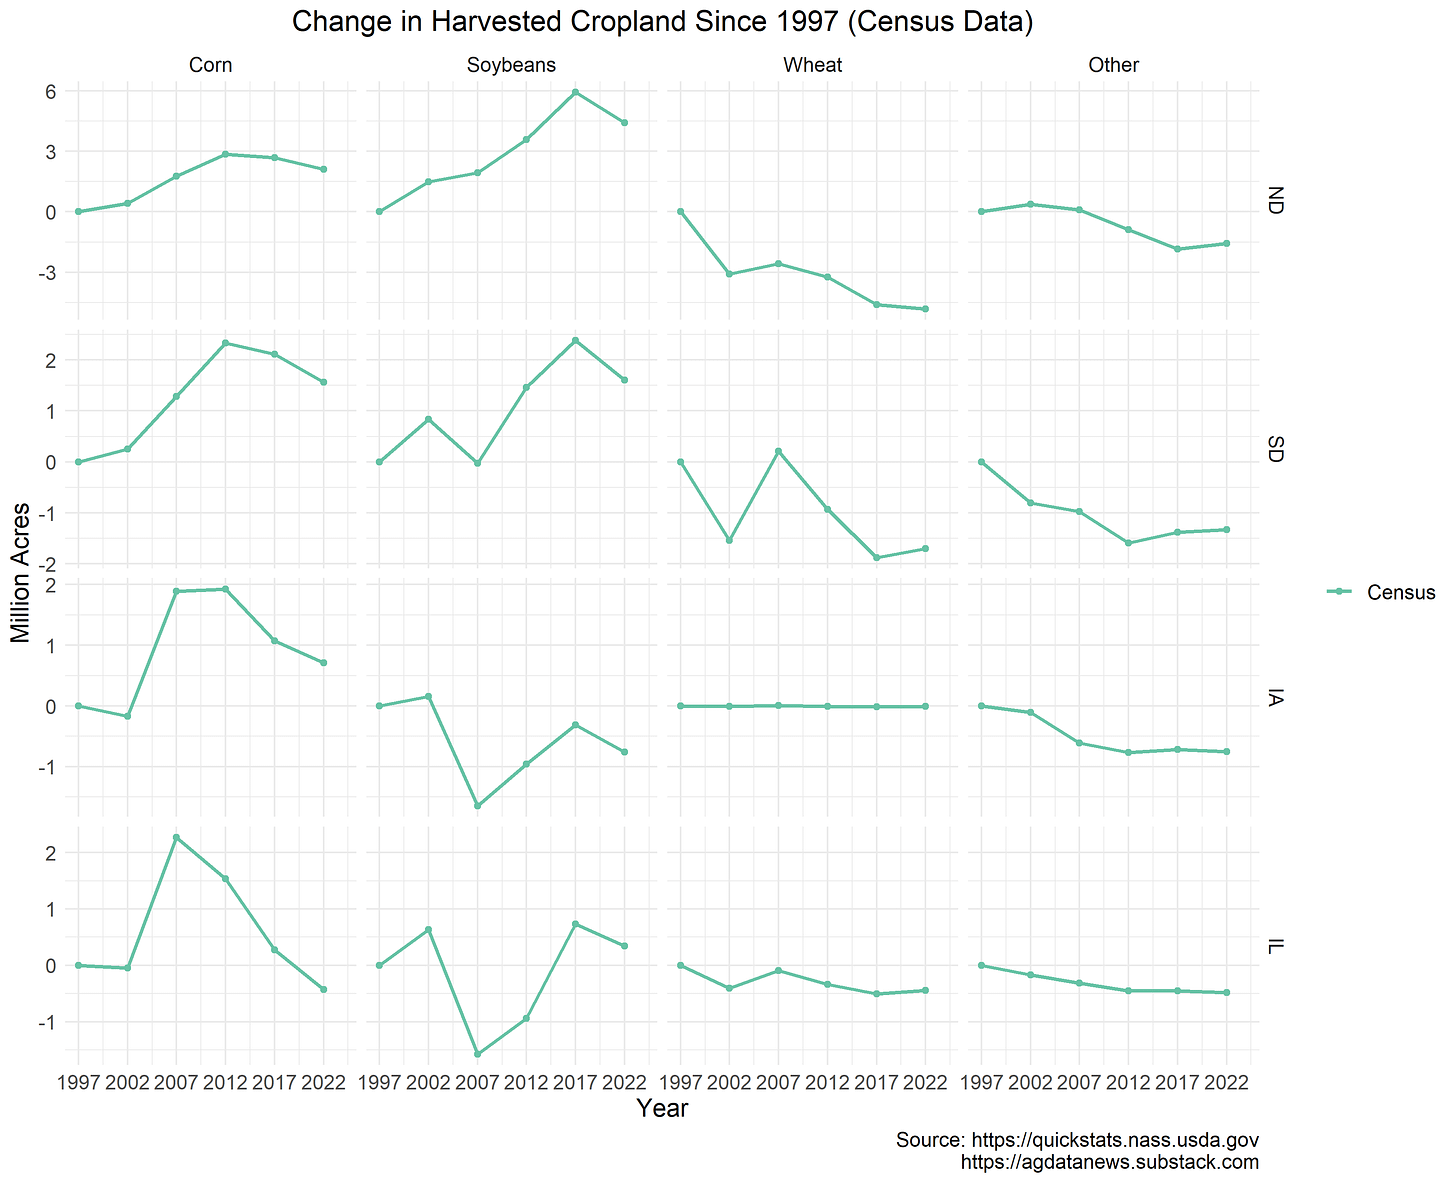
It's mostly corn and soybeans. Harvested acres of these crops were down by 2.1m in ND, 1.3m in SD, 0.8m in IA, and 1.1m in IL between 2017 and 2022. Changes in other crops were negligible over this period.
So are farmers moving out of corn and soybeans?
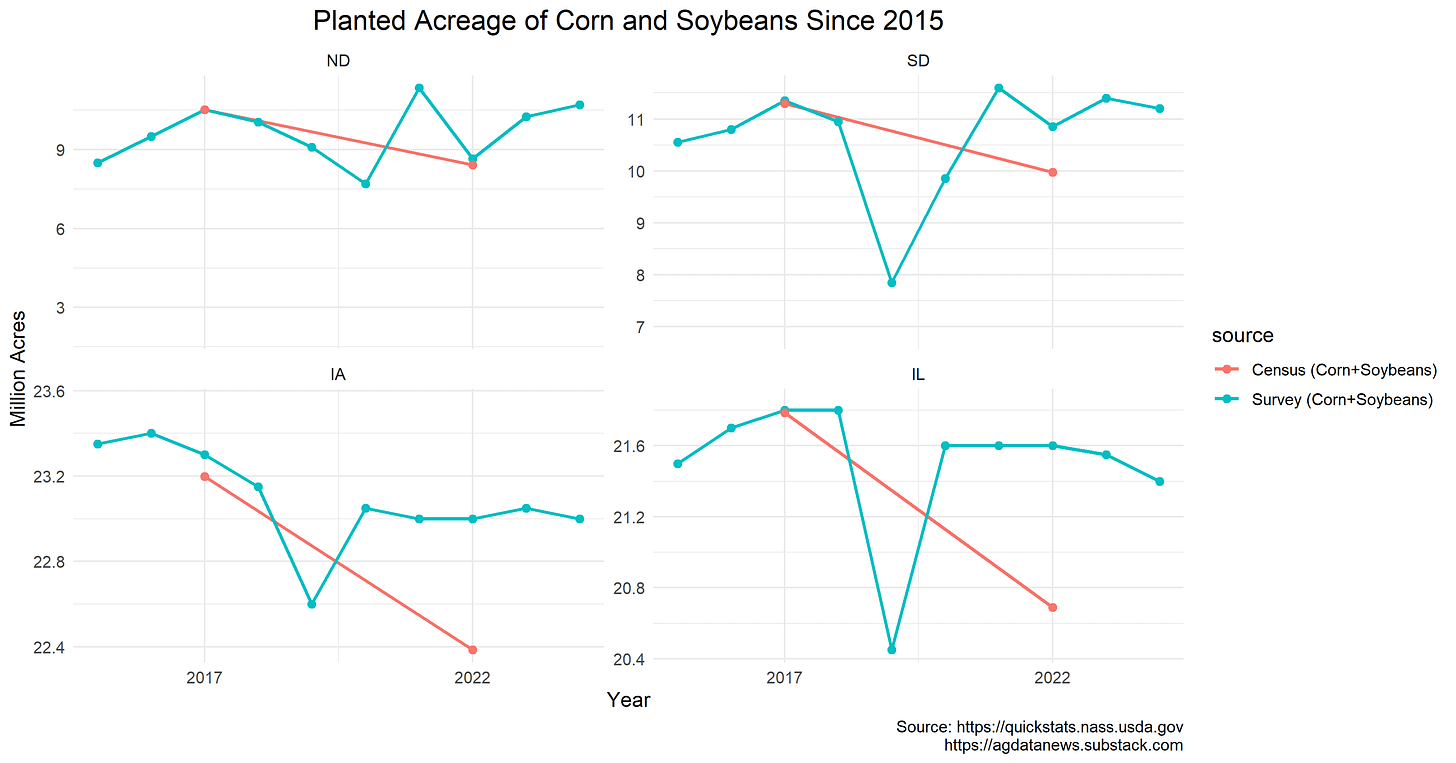
In short, no. The graphs below show annual planted acres as reported from USDA survey data. I consider these data to be quite accurate for corn and soybeans. The USDA Farm Service Agency, which is the part of USDA that administers farm programs, requires all farmers who participate in crop insurance, farm credit, or disaster programs to report all cropland use on their farm. Almost every corn and soybean grower participates in these programs, and so they should be included in the data.
The survey data show that farmers in the Dakotas plant varying amounts of corn and soybeans each year depending on prices. For example, soybean plantings were low in 2019 because the trade war with China reduced demand for US soybeans. Plantings in 2022 in the Dakotas were lower than in adjacent years, but in general planted acres in the Dakotas have trended upwards in the past decade. The gap between survey and census data is small in North Dakota, but in South Dakota the census counts 900,000 fewer acres in 2022 (8%).
Farmers in Iowa and Illinois have decreased corn and soybean acres somewhat over the last decade, but by much less than implied by the census. The survey data imply that, between 2015 and 2024, corn and soybean acres declined by 1.5% in IA and 0.5% in IL. Planted acres have been quite stable in the last five years. In 2022, the census reports 600,000 fewer corn and soybean acres in Iowa than the survey. In Illinois, the gap is 900,000 acres. These are large differences at 2.7% and 4.2%, respectively.
Thus, for three of the four states with large cropland declines in the census (SD, IA, IL), the decline matches a large gap between the two data sources. I don't know what explains this, but it sure looks like the 2022 census significantly undercounted corn and soybean acres in multiple Corn Belt and Great Plains states.
I made the graphs using this R code.


