This article was written by UC Davis ARE PhD students Gina Pagan and Sam Cameron. It is the third of several excellent articles written by students in my ARE 231 class in Fall 2023 that I'll be posting here.
California passed Proposition (Prop) 64 in November of 2016, which legalized the adult recreational use and cultivation of cannabis. Prop 64 made California the equal sixth U.S. state or territory to legalize recreational cannabis use, following Colorado and Washington in 2012, Alaska and Oregon in 2014, and Washington D.C. in 2015. The first California shops opened their doors to recreational users beginning in 2018.
Since legalization, California has risen to the top in terms of statewide consumption and is one of the largest producers of cannabis nationwide. In 2022, California produced 577 metric tons of legal cannabis, trailing only Colorado (623) and Oregon (614) in total production weight. This production generated $1 billion in wholesale value, more than any other state in 2022.
However, this billion dollar value was 40% below 2021 levels despite a 12% increase in year-over-year production weight. Cannabis was the state’s 5th most valuable crop produced in 2021, but slid to the 8th position the next year. What are the drivers of this 40% decrease in production value, and why should economists and policymakers care?
The answer lies in the low deserts of southeast California, the dense forests of Northern California, and everywhere else a makeshift greenhouse can escape relatively unnoticed. These (somewhat) hidden operations fuel an industry much larger than the legal cannabis market --- illegal weed distribution and sales. Dan Sumner and co-authors estimate that in 2020, less than one-third of in-state cannabis sales occurred in legal settings. The influx of illegal weed pushes prices down in legal markets, forcing legal growers and distributors out of regulated markets and turning consumers and entrepreneurs alike to illicit markets.
Marijuana farms in California vary widely in size and structure. The state of California permits cultivation of cannabis to occur outdoors, indoors, or in greenhouses, and different permits are required based on the size and growing setting of the license holder’s plot. The different cultivation methods lead to essentially the same commodity but there are trade-offs associated with each. Greenhouse cultivation has the highest yield but uses extraordinary amounts of energy for ventilation and temperature regulation. Outdoor growing is far less energy intensive, but has greater risk for natural shocks (e.g. soil erosion, pest infestation, other sources of crop loss). Indoor cultivation uses heat lamps, which allows a flexible growing climate but requires costly technology. The high costs of operating a greenhouse or indoor grow site legally prevent many small growers from reaping the benefits of high in-state cannabis demand.
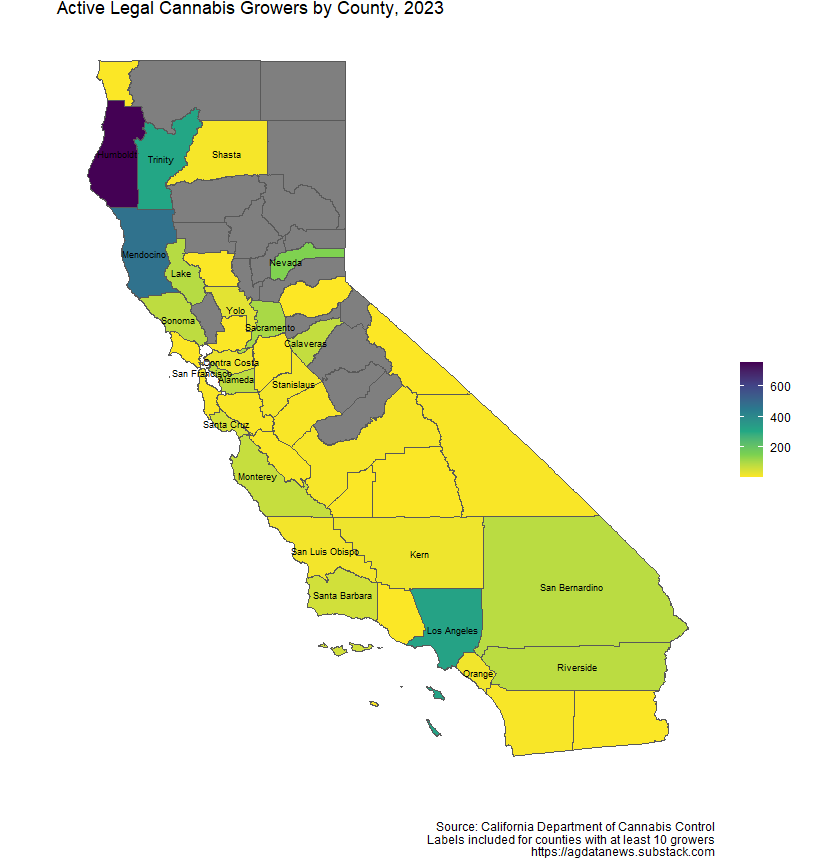
Though legal at the state level, counties and even individual cities can prohibit various types of cannabis businesses. The California Department of Cannabis Control (DCC) reports that only 31% of cities and counties allow cultivation. The number of businesses with active cannabis cultivation licenses in 2023 by county. Humboldt County stands out with over 1,250 licenses issued to 756 growers, followed by Mendocino County with 472 licensed growers.
There is relatively minimal overlap of cannabis production with other crops. Humboldt, Mendocino, and Trinity counties (together known as the ‘Emerald Triangle’) led the nation in medicinal cannabis cultivation prior to legalization, making the transition to adult-use production straightforward. Conversely, in the 18 counties comprising California’s Central Valley, the state’s hub for crop production, there are only 209 licensed cultivators in 11 counties. Therefore, the state essentially sorts itself into predominantly traditional agricultural counties or predominantly cannabis cultivating counties.
The maps below show this dichotomy. The counties in the left and middle figures vary from dark red counties with the least traditional agriculture to green counties with the most traditional agriculture. On the right, the red-orange areas are those that prohibit cannabis cultivation. There appears to be a negative correlation between how much cropland is in a state and whether growing marijuana is legal. This is likely due to the perceived threat cannabis cultivation poses to traditional farming; growing cannabis requires water, land, and other resources important to existing farmers that would become more contested if cannabis cultivators were allowed to operate.

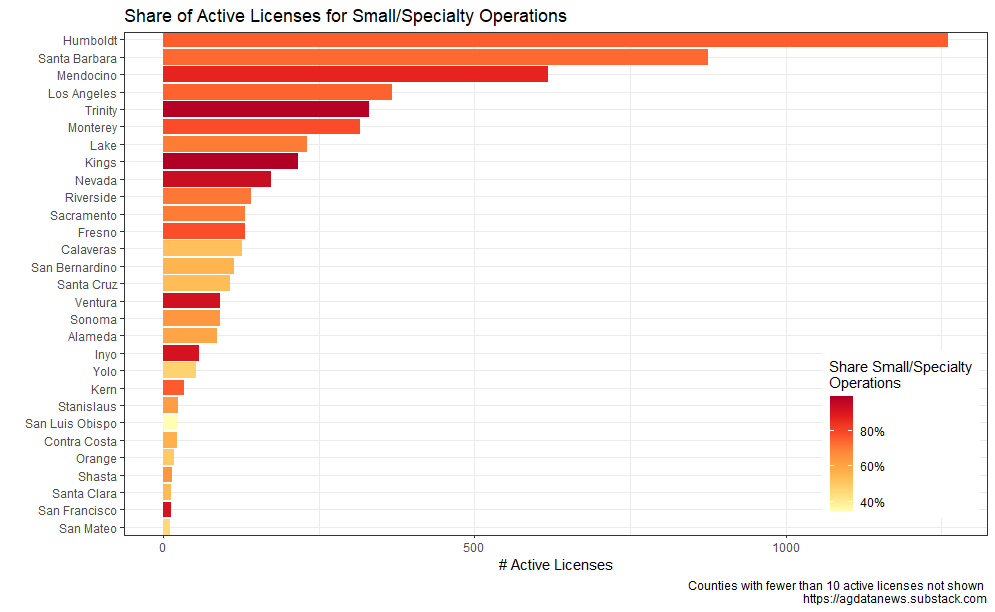
Unlike the state’s food production, a majority of legal cannabis cultivators are small or specialty operations rather than large consolidated firms. Specialty cultivation licenses are for operations with under 5,000 square feet of canopy, and small licenses are for operations with between 5,001 and 10,000 square feet of canopy. The chart below shows the number of active licenses by county, where each bar is colored by the share of active licenses that are either small or specialty operations. It is these types of growers that are most harmed by the intruding illegal cultivators, cutting into profits and even forcing closure of some businesses due to decreased prices of cannabis in the market.
Legal growers, especially small operations, are further disadvantaged by being in the legal market due to environmental compliance costs. Cannabis cultivators are required to adhere to California EPA (CalEPA) policies regarding chemical application, irrigation, and energy use. These same rules are rarely adhered to by their illegal counterparts. Criminal cultivators steal water, use illegal chemicals, and cause massive amounts of environmental damage in the areas they grow. Although illegal markets are exceptionally difficult to analyze and measure, a lot of the externalities that the marijuana market causes are not being accounted for. Remote sensing has proved a powerful tool in the identification of illegal grow sites, but the scope of the damages being created cannot be properly captured without complete data.
CannaVision, a tool utilized by the California State government, used remote sensing techniques to identify illegal cannabis cultivation sites. The Los Angeles Times reports that CannaVision revealed in August 2020 that there was more illicit cultivation than legal in the “Emerald Triangle” of Northern California. The Times’ own analysis of satellite imagery showed that the ratio of illegal to legal growth acreage is as much as 10:1 in some of the biggest cultivation areas in California. The densest identified area of illegal marijuana growth in this analysis is Juniper Flats, an area 100 miles northeast of Los Angeles, nestled in the desert of the Sierra Nevadas and stretching into the Mojave Desert. In 2021, there were 1,300 grow sites in this region alone, stretching over 10 million square feet. This represents a 4,200% increase in grow sites since 2018.
Although production value of California’s cannabis crop has fallen, consumption has not. Demand for weed will not likely go away in the future, as attitudes toward usage become more positive among California adults. As the state seeks to achieve ambitious environmental goals, policymakers can look to cracking down on illegal grow sites to preserve scarce resources and keep small businesses active.
We made the first map and the bar chart using this R code.


